Oz du Soleil experiments with how to visualize music in Excel. To do this, he takes the song “Pressman” by Primus. Oz is a bit of a bass player, so his choice of Primus is… well… not entirely unexpected.
Shocker.
But what is a bit surprising… or novel… is how he uses Excel in a way that most people would not consider. Turning on and off different accompaniments, so that he can visualize the instruments that are being played at different parts of the song. Its an interesting approach that is worth exploring
So Let’s Explore

Go to the Developer Tab
If you don’t see the developer tab, then go to
Preferences>Sharing and Compatibility>Ribbon
select “Developer”
Please note tat your particular version of Excel may reveal the developer tab in different ways.

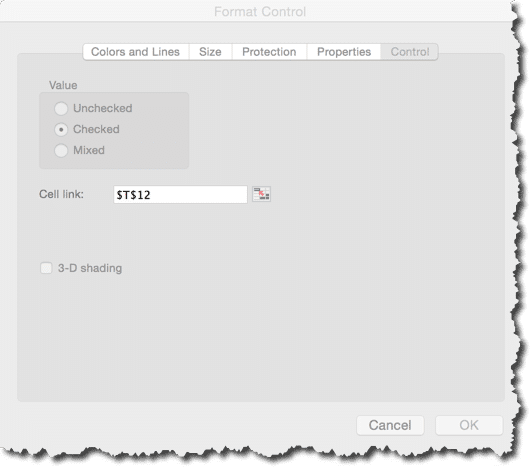
Insert Radio Buttons
In the video Oz shows you how he the radio buttons to place a number (such as 1, 2, 3, 4, 5) based on which radio button is selected. In Oz’s example, he places the value in cell T12

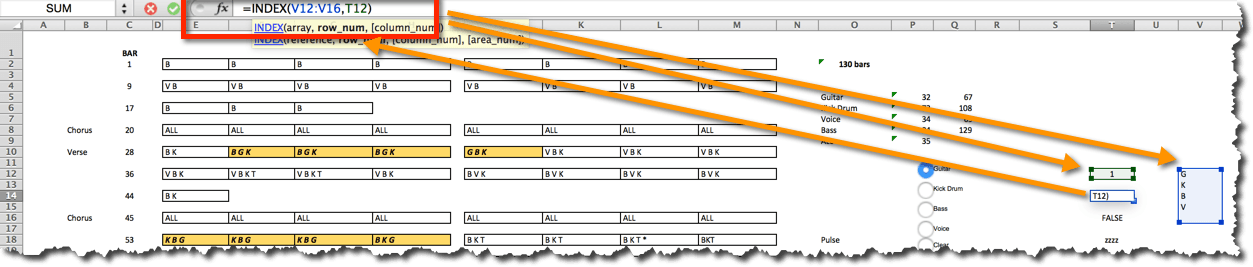
Use and Index Formula for the Lookup
Use and Index formula to grab the value from Step #2 to perform a lookup.
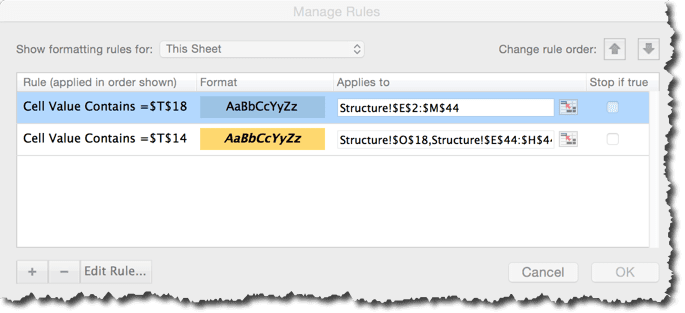
 Apply Conditional Formatting
 Apply Conditional Formatting
The conditional formatting formula that is used looks at cell T14 — which is where the calculation from Step #3 was performed, and looks to see if that value is found anywhere in the the measures (columns ‘E’ through ‘M’).
BONUS Download
- The Comprehensive Guide to the Excel Ribbon: Making the Most of Your Data - January 31, 2023
- 51: Oz du Soleil & the Global Excel Summit 2021 - February 8, 2021
- 50: Randy Austin – Excel for Freelancers - January 22, 2021

Rick Grantham,
Thanks for the post. This is a very nice way. I enjoyed it really and mentioned this technique in my blog post.
http://goo.gl/zHfjxI
Thanks again to Oz du Soleil for this nice tricks.
Regards
Kawser Ahmed
Data Lover