Be the HERO in Your Office
Click to play
Learn to dominate Excel & Analytics even if you are new or overwhelmed
Eliminate the risk to your job by becoming the Excel & Analytics ninja in your office
I understand the risk that we all face in our careers. That risk, combined with Inflation, food shortages, gas prices... can devastate our emotional, financial and physical health.
When COVID hit the TV screen almost 3 years ago, I was legitimately scared. I am not normally a guy who freaks out over stuff. It's just not my nature. Too many years of meditation and whatnot has calmed me. One of the chillest guys you will ever meet. Almost to a fault.
But I was immediately called back from my gig. I was working full-time as a consultant at the Santa Cruz Water Dept. in California. Travelling weekly. Suddenly, no travel. And no gig. As an executive at a consulting firm (running the analytics arm of the business) I know full well that consultants are the first to go (you pay us a lot... but you also pay us to go away). But when you go a bit without being billable to a client... your job is at risk.
I pay a lot in child support and I have responsibilities. Perhaps I share too much, but it's true. There was a lot of risk. And I was scared.
The thing is... I know that anxiety... or whatever you want to call it... hit a lot of people. The risk. Perhaps you as well. I was more financially concerned than I had been in 2 decades.
I believe that what saved me was some natural skills that I have (communication, analytics) and my dedication to self improvement. Some of my peers didn't make the cut. Scared the shit out of me. I gained weight. It wasn't good.
Regarding self improvement... in this day and time, I believe it not only saved my job. But it is also something everyone should be doing. Hit the gym. Communicate with your loved ones more. Connect with your higher power (whatever that means to you). And all of those things are almost impossible when you are scared shitless about your job. It impacts all areas of your life.
Over the years, through the connections I have made at Excel TV... there is a fairly big library of courses and webinars to make you the ninja in your office. So I turned it all into an Academy.
The Excel TV Academy is a one stop subscription to all my courses. Look at it as a vault of all my stuff. 7 courses, webinars, etc.. Created by the top Excel minds in the world. All positioned to eliminate the risk to your job and your financial well-being. And by extension, the risk to your family, your health and your inner peace.
Introducing Excel TV Academy
The Excel TV Academy is a one-stop shop of everything you need to become the Excel/Analytics Ninja in your office. To be the person that managers and colleagues come to when they want things done quickly and done perfectly. All the courses are taught by leaders in the Excel industry. Excel authors, bloggers, and conference speakers. All curated into the Excel TV Academy to make you someone that is indispensible.
Here’s What You’ll Get When You Sign Up
You will get immediate access to 8 courses, including over 60 modules and over 500 lessons. You also get access to several bonuses (webinars, Excel resources, etc). Tons of practice files. We will not 'drip' content to you. Rather you get access to everything all at once. Move at your own pace.
There is also a printable certificate at the end so that you can confirm your competence with your company. This also includes a QR code so that your company can verify the authenticity of your completion certificate.
When you finish, you can maintain access to all the courses for reference. Afterwards, you will have proof of your value to your organization and improve your job security.
Save Time
SAVE HOURS on your reporting and data analysis when I show you important Excel tools and features
Become More Efficient
Never start your Excel projects over again! - Get smart, reliable answers to your Excel questions that are easy to follow and are straight to the point
Make More Money
Get promoted sooner, make more money, impress your leaders by turbo charging your Excel skills
Improve Your Career Options
Printable and downloadable certificates are available at the end of each course. This is suitable for sharing on LinkedIN and hanging in your office.
Here’s what people are saying about the
Excel TV Academy
Leaders in the Excel industry rave about the Excel TV Academy and our courses.
The Academy helps students and employers obtain huge benefits
")
Chris Newman
Owner: TheSpreadsheetGuru.com
Differentiate Yourself From Your Colleagues
Excel Dashboard Pro is a tremendously well though out course filled with practical techniques that can be applied in a variety of ways in the corporate world.
I thoroughly enjoyed taking this course and highly recommend it to anyone who wants to differentiate themselves from their colleagues.

Orlando Mezquita
Owner: MasterDataAnalysis.com
Excellent to learn about Efficient Data Visualization
Create stunning visualizations with simple Excel techniques. No complex programming in VBA, just Excel formulas.
I would definitely recommend this regardless of your Excel expertise.

Brad Edgar
Owner: Brad Edgar.com
I would definitely recommend this for any skill level
You will learn how to build clean and non-bloated spreadsheets that are easy and effective at providing and displaying visualizations that truly captures and provides the information that the end user is looking for.
Here is what you get
Make yourself indispensable with the Excel TV vault of over 60 modules and over 500 lessons
taught by the greatest Excel minds in the industry
1
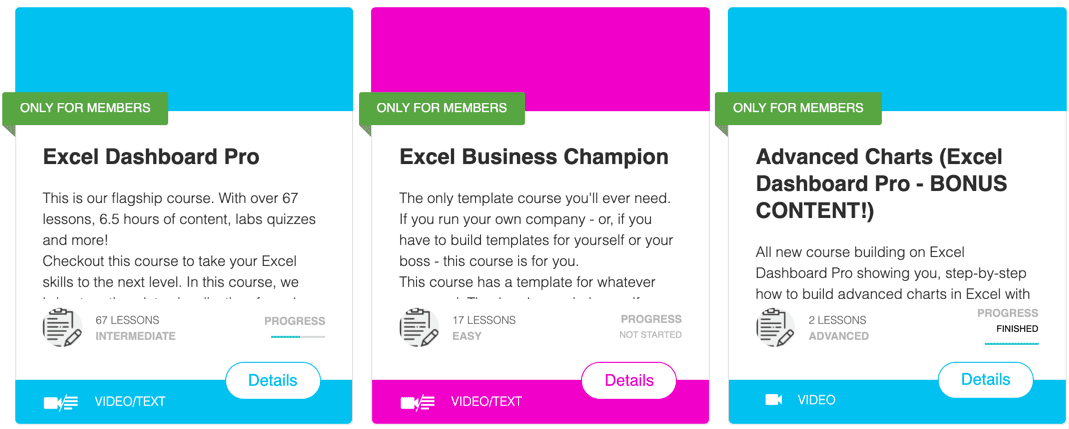
Course 1: Excel Dashboard Pro
This is our flagship course. With 16 modules & over 67 lessons, 6.5 hours of content, labs quizzes and more! Your course instructor is Excel MVP & author Jordan Goldmeier.
In this course, we bring together data visualization, formulas, charts, and more to create interactive reports and models. Your bosses will be shocked by the stuff you’ll learn to create. After this course, you’ll never use Excel the old way again.
2
Course 2: Xtreme PivotTables
This course is packed with content. 17 modules and 231 lessons. Your instructor is Excel MVP & best selling author John Michaloudis.
Go from 0 to Pivot Tables. If you’ve ever wanted to become awesome a Pivot Tables, this course is for you.
3
Course 3: Intro to Power Query
Excel MVP & author Jordan Goldmeier is your instructor for this course. Containing 4 modules & 14 lessons
New to Power Query? Watch how you can use Excel’s new data manipulation tool to optimize your time across multiple workflows.
4
Course 4: Data Modelling in Excel
Excel book author and consultant Szilvia Juhasz offers this course which includes 6 modules & 70 lessons to include labs.
The course will take you through all the formulas and show you tips/tricks that will make you stand out in the office
5
Course 5: Data Science with Power BI & R
Ryan Wade, consultant, conference speaker, and the author of the book 'Advanced Analytics in Power BI with R and Python: Ingesting, Transforming, Visualizing'. The course includes 8 modules and 57 lessons.
This information is so new, we're confident this is the only course out there right now that brings it all together. This course combines data analysis, visualization, and even machine learning to make you that indispensable expert at your office.
6
Course 6: Building BI with PivotTables
Ken Puls, consultant, conference speaker, and the author of several Excel & Power Query books brings you this course with course includes 8 modules and 82 lessons. Ken has been a Microsoft MVP for every year since 2006.
BUILD ONCE. IMPRESS BOSS FOREVER. Time is money. If you have to rebuild your business intelligence delivery each time, you're wasting your most valuable resource. This course will show you step-by-step how to quickly build business intelligence solutions once and then reuse them across your organization.
7
Course 7: Error Checking for Excel BI Solutions
Acclaimed Excel and Business Intelligence expert, Ken Puls. brings decades worth of hard-won knowledge delivering business intelligence solutions to small business and enterprise-level leadership. He has been awarded the prestigious Microsoft MVP award every year since 2006, has authored two books on Excel development, and is founder of Excel Guru.
Spreadsheets are commonly riddled with errors and issues. So many courses focus on how to do new things in Excel. This course will show you how to improve your current models and pivot tables. If you're the person in the office who creates clean spreadsheets--and can handle errors on the spreadsheets of others--you'll become indispensable.
Bonus
But wait... there's more.
In addition to a top-of-the-line learning platform, I have also added several bonuses. The bonuses listed below are the immediate bonuses. But as an Excel TV Academy member, you will have access to all courses and bonuses that are added in the future. Look at the Excel TV Academy as a vault of all our stuff.
Access to everything.
Visualize Anything in 4 Easy Steps
This 80 minute recorded webinar shows you how to visualize anything in 4 easy steps.
What you'll get...
- 4 steps to visualize anything
- 5 principles of data vis
- a common sense guide to data visualization
Chances are you believe in the power of data story telling. But not all data visualizations are created equal. What does the data visualization research tell us?
And how we can evaluate our own work to ensure it tells the right story?
In this BONUS TRAINING we will describe exactly what you need to know to tell effective stories with data visualization.
3 Excel Dashboards in 90 Minutes
This 90 minute recorded webinar shows you how to create stunning dashboards to stand out in your office.
What you'll get...
- Create stunning interactive dashboards
- No VBA required
- Create your first dashboard in 5 minutes after the course!
Chances are you're using Excel now more than ever before. But are you making the most of its charts and graphs?
Did you know you can make amazing interactive charts in minutes? With no VBA or Power BI? It's true
In this BONUS TRAINING we will show exactly how I build 3 data visualizations in < 90 minutes
You can use them immediately in your dashboards, reports, and presentations.
Excel TV Resources
Want to further your analytics career?
This bonus includes two great guides that were curated by a career Excel consultant.
What you'll get...
GUIDE 1 - Getting Hired in Excel
- How to be bold and differentiate yourself
- How to craft a killer resume
- How to ACE an interview
- Tips on how to best iterate until you've found what works.
GUIDE 2 - Scoping an Excel Project
- Technology/capability focus
- Deliverable Focus
- New is always better
- THE FIVE QUESTIONS YOU SHOULD ANSWER BEFORE STARTING AN EXCEL PROJECT
- Download the Project Proposal Template
Presented by
Rick Grantham
Rick is a Six Sigma Blackbelt and an Executive at a Business Intelligence Consulting firm. He has led Business Intelligence deployments on 5 continents and has been in Analytics for 25 years.
He fell in love with Excel early in his career when was in finance, building pricing models and forward looking financial statements for $100M+ deals.
He built this community as a way of giving back.


Here’s what people are saying about the course instructors
Our instructors are top notch. They own their own websites. They are authors, conference speakers and highly regarded in the Excel industry.

Abdul Haseeb
CFO
Instructor Jordan Goldmeier
I love the way how Jordan explains different topics and bring the students up to speed with what he is trying to explain. His method is very engaging and simple and i like how he takes time to go into detail explaining different ideas.

Fay Low
Online Student
Instructor Ken Puls
There are very few Excel instructors such as Ken who are as knowledgeable and practical on the topic: his enthusiasm inspires one to learn more. In addition, his style of teaching is unique; he shares and provides practical examples to use Excel efficiently and effectively. His classes are well organized, systematic, logical which makes learning easier. Hence, I would definitely recommend Ken.

Thomas W Newton
Veteran Lawyer & Sr. Executive
Instructor Szilvia Juhasz
Her patient, easy-going style enhances the learning experience and helps assure buy-in. Szilvia teaches in every-day English, not PC-ease. Whether training in a classroom environment or doing side-by-side, Szilvia’s pupils get it, and enjoy the experience.
The Excel TV Academy is all you need
Is your job keeping you up at night?
Spend more time doing the things you love, challenging your intellect, and working on meaningful projects.
What could you do with your new knowledge? Start a blog? Get a promotion?
Our instructors are highly sought after conference speakers, authors and corporate trainers. To spend a week with just one of our instructors would easily cost $5,000, plus travel and other expenses.
If you wished to see all of our instructors at a conference, you would need to purchase a conference ticket ($2,000), air travel, lodging, meals and other expenses ($3,000). For a total of $5,000. And even then, it would be a couple hour long or half day sessions and you would't be able to leave with a recording of the session for home study.
If you wanted personal time with any of our instructors, it would easily cost you $200 an hour.
If you purchased all of the courses in the vault separately, you would spend over $2,000
Monthly subscription
You get everything. All at once. Cancel at anytime
$
97/Month
Annual subscription
You get everything. At a 60% discount compared to the monthly installment
$
497/Year
Discount has ended
You missed out!

100% Satisfaction Guarantee for 30-Days
No gimmicks, no bullshit. We don't hire professional instructors to create our courses, and we don't make "copy courses" to compete with the big providers. We're proud to offer something different: courses taught by professional-professionals on topics we know are important to you.
Professional-professionals? Yes, our course instructors are professionals first. We've had years in the trenches and they bring what they've learned to you, not from a course instruction booklet but from tireless experience. We promise the unconventional, the new and exciting, and the bold.
Our courses teach you what others don't, and that's exactly the way we like it.
If for whatever reason, you are not satisfied within 30 days of your purchase, let us know for a full refund. No. Questions. Asked.
Don’t wait! Look at what others have to say about the Academy
Our current and past customers rave about the Excel TV Academy

Debra Grant
Financial Analyst
Would Definitely Recommend
One of the great thing about the courses taught here is that they are unique and teach you to work differently and think outside the box. The methods explain are fairly simple and yet so powerful it almost seems unreal.
I would definitely recommend Excel.TV to my friends and colleague and that is because i think it has some really cool tutorials and some of the techniques shown here are definitely worth learning.

George Mount
Owner: StringfestAnalytics.com
Pull out a few key words for a testimonial title
This is not another “brain dump” of meaningless Excel tips and tricks. The course walks you through the theory of data visualization and dashboards with Excel applications. I have used Excel for thousands of hours and still found new, helpful tips in this series.
The course is also great for newer users of Excel -- it requires absolutely no knowledge of VBA or PivotTables, and [the instructors] do a great job getting all users comfortable with the tools used in this course. Data visualization and dashboards are powerful techniques for making sense in today’s data deluge. I would recommend this course to those who want to be able to communicate with their data. This is a critical skill for success across roles and industries.

Rahim Zulfiqar Ali
Owner: StringfestAnalytics.com
I love the topics
I am Corporate Trainer for Microsoft Excel and provides training to various organizations via Excel Online and Onsite. I have done MSOS, MSOE and MCT.
I usually follow two rules for making dashboards.
1. CRAP Rule (Contrast, Repetition, Alignment & Proximity)
2. MVC Rule (Model, View, Controller) Using of Shapes, Sparklines and Charts for visualize.
I love specific topics like Visual perception, Gestalt's Law of Grouping, Data viz vs infographics so overall section of "A primer on Data Visualization" plus array formulas and section
Frequently Asked Questions
Anyone who wants to elevate their Excel knowledge & skills, including….
- New users, beginners, intermediates and advanced Excel users.
- Professionals working in the corporate world or government sectors who want to leverage Excel for increased productivity, accurate data management and reporting.
- People who want to change career and apply for a new job that requires knowledge of Microsoft Excel
It doesn’t matter if you are completely new to Excel. No prior Excel knowledge is necessary to participate in the Academy.
The tutorials were recorded using Excel 2010, 2013, 2016 & 2019 and Office 365
Most of the concepts taught are compatible with:
- Excel for Windows: 2007, 2010, 2013, 2016, 2019, Office 365
- Excel for Mac: 2011, 2016, 2019, Office 365
You get access to all the training materials.
You can access the course site from your work computer, home computer, tablet, smartphone or any other device with an internet connection.
The course site remembers your progress, so you can pick-up right where you left off on any device. That means you can watch a few videos at work, then continue right where you left off on your home computer.
For the LIFETIME MEMBERSHIP special, you have access to everything forever.
For the subscription model, you have access until you cancel or the subscription ends
For the subscription Plan - You have access until the subscription expires or you cancel.
Yes! You will be able to download all the files used throughout the course. This makes it easy to follow along and practice with our data.
Yes, the Academy (including your student dashboard and all the training materials) can be accessed on any tablet or smartphone, and it looks beautiful. You can watch the course on your iPad or Tablet while following along with the Excel files on your computer screen.
Each video has a discussion section. You can use this section to ask questions and see what questions other students have. We will be there helping to answer your questions.
You can also send an email to our dedicated email support if you cannot find your answer.
Yes, you can use your company's credit card to pay for the course. A receipt will also be emailed to you that you can submit for reimbursement to your employer. Most companies are willing to invest in making their employees even more awesome at Excel!
Yes, there is a team package available at a discounted price. If you get 2 or more of your colleagues or friends to join up to The ExcelTV Academy, then we will give you both a 30% discount on your membership! Each team member will have their own account and be able to track their progress in the course. Please contact us ([email protected]) if you would like to register more than 2 member.
If you paid for this one-time payment - you will pay a one-time fee for lifetime membership.
If you signed up for a subscription, then you will be billed in cadence with that membership until you cancel.
You can get a full refund of your purchase within 30 days of Academy enrollment, with our 30 day money back guarantee.
You can cancel your Academy Membership at any time during your subscription.
If you are cancelling your membership outside the initial 30 day money back guarantee period, a refund will not be issued for your account.
We accept all major credit cards like Visa, MasterCard and American Express, as well as PayPal for the annual membership only.
If you want to pay using PayPal, email us at [email protected]
The course fees are shown in USD $
Get in contact with us if you want to pay via bank transfer or check at [email protected]
If you need a Tax Invoice for your records, then this can be emailed to you.
We are happy to complete any paperwork your company or government may require.
Monthly subscription
You get everything. All at once. Cancel at anytime
$
97/Month
Annual subscription
You get everything. At a 60% discount compared to the monthly installment
$
497/Year
On a personal note
Thank you for considering being part of this community.
This Academy brings together all of my Excel & Analytics expert friends in the community. This is something that I am extremely proud of and that is unique in the industry.
I look forward to helping you stand out in the office and not only find the security that we all want in our jobs, but to also be the 'go-to' expert when people need things done right!