In the post-apocalyptic world, can you visualize how much time would you have before the Grim Reaper shows on your doorstep? Well, you don’t have to worry about it now. Also, given that Oz du Soleil is here, you do not have to worry about making timelines.
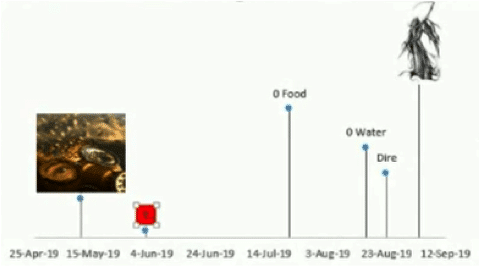
Oz is taking us through an exploratory (and creative) journey of building timelines in Excel 2013. The end result could look as amusing as the image on our right.
How To Graph A Timeline In Excel
 Add Label Height to your Timeline Data
 Add Label Height to your Timeline Data
Labels on the bars of your timeline may overlap. Adjusting these ‘label heights’ will prevent this overlap from taking place.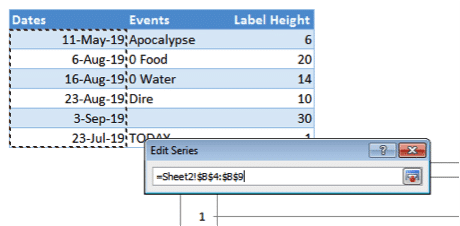
 Create a Scatter Plot
 Create a Scatter Plot
Go to Insert > Scatter under Charts. Scatter plots include a wide array of options which we shall exploit to make our data look like a timeline.
Now within Design > Select Data, click on Add. Select the ‘Dates’ as the X values and ‘Label Height’ as Y values.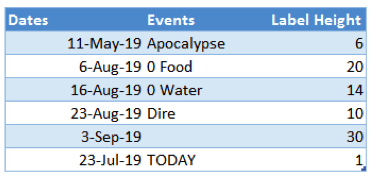
 Formatting the Scatter Plot
 Formatting the Scatter Plot
- Delete the ‘Chart Title’ and grids as pleases you.
- From Chart Elements add Error Bars. Delete the horizontal error bars. Now format the vertical error bars so that they only have minus at 100% error.
- Now add Data Labels to your chart above the data points. Edit them to Value From Cells and select the descriptions under ‘Event’.
 More Formatting
 More Formatting
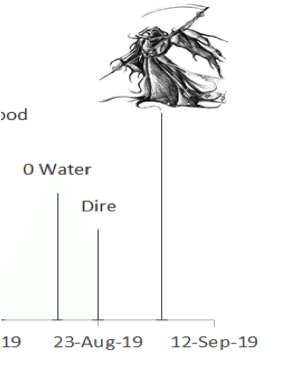
- Select any data label and press File under ‘Insert picture from’. Select any picture you want and resize it as it pleases.
- Delete the cell containing the event description if you only want the picture to appear.

iii. Edit other data labels as your desire.
Step 5: Done!
What you have now is a dynamic (and cool) timeline. If the table containing your timeline data is connected to some cells or contains some calculations, the timeline will get automatically updated as these cells or calculations change, respectively. Why else would you want to use the power of Excel to make timelines!
Get the Download
Excel-timeline <————– Click to download the file that Oz used
What’s next?
The next time you have to make a creative-looking timeline and are worried about the data changing, use what you just learned.
Lastly, share this awesome trick with your friends!
- SSSVEDA DAY 7 – Every Team Needs Someone Who Understands Data - February 18, 2018
- SSSVEDA DAY 5 – When Data Analysis is Wrong - October 31, 2017
- SSSVEDA DAY 4 – Sharing the Excel Knowledge - July 18, 2017
