Given a rich data set, making pivot tables and charts is amongst the first tools we use to start analyzing that data. But what normally gives insight is how one drills down into the data: to find out hidden patterns or correlations or check for anomalies. Observing a striking phenomenon and then finding out the data points leading to that phenomenon can require a lot of data manipulation. And so much effort can almost always lead to a lot of stress!
Well, there is a stress-free way of drilling your data using Quick Explore (Excel 2013). And Oz is here to explain how to use it.
So, let’s get our data sets out!
1 – The Data Model
Once you have your data in place, create a Data Model from it. You can find the tutorial the tutorial here: link to the post covering introduction to data models
Now that all your data tables are properly linked and you have a data model in place, let’s proceed.
2 – Initiating the Drill
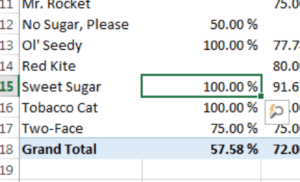
In your Data Model, you notice a peculiar figure and, now, you want to figure out which data points are leading to this figure. Well, just click on it for starters.
You would notice that a special symbol (containing a magnifying glass and a lightning bolt) appears on the corner. Click on it.
3 – Lets Drill
A menu would now appear showing the options of variables you can drill down to.
Select the variable of your choice, and Excel will apply the relevant filters to your table. This way you would be able to see the data points used in calculating that figure. And also figure out what is so unique about them.
Note that regular Pivot tables do not offer this functionality.
4 – Application
The use of this tool will obviously be in checking out the data points behind various anomalies or striking figures that you may notice. And the good part is that you do not have to fall back on your raw data or manipulate your pivot table. Quick Explore presents to you the relevant data points in a summarized, meaningful fashion.
Get The Download
[thrive_link color=’teal’ link=’https://excel.tv/wp-content/uploads/Data-Models-Bull-Riding.xlsx’ target=’_self’ size=’small’ align=’aligncenter’]Get The Excel Download Here[/thrive_link]
What’s next?
Start experimenting! Fire up your data and let Quick Explore rip everything open to you. Also, share this cool feature with your friends and help them combat some miseries of exploring data sets!
- SSSVEDA DAY 7 – Every Team Needs Someone Who Understands Data - February 18, 2018
- SSSVEDA DAY 5 – When Data Analysis is Wrong - October 31, 2017
- SSSVEDA DAY 4 – Sharing the Excel Knowledge - July 18, 2017

Just double click on a value in a pivot table gives you also the underlying data. So no magnifying glass is needed.