What to do when you are offered ghost peppers or Trinidad scorpion peppers? Which one would you choose? Oz is here to help us out.
Let’s get started!
1 – The Evidence
The chart on the right displays the Scoville Heat Units (SHU) of different peppers. Poblano isn’t even that hot. And Trinidad scorpion peppers doesn’t even score twice as hot. I guess, we can handle it after all.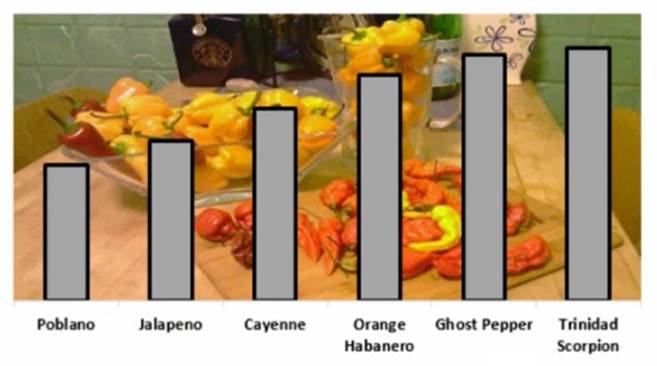
![]()
But, wait a minute! Is there some trickery at work here?
2 – The Deception
When we add vertical axis to our chart, the entire result changes. Turns out that the creator of this chart had enabled logarithmic scale using Axis Options. Of course, he then deleted the scale to hide any trace of the change!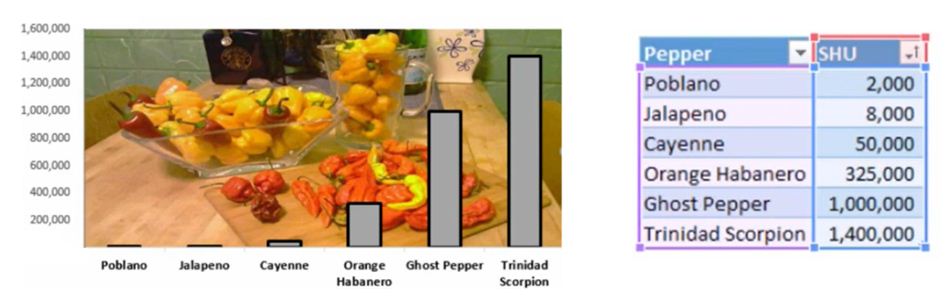
![]()
![]()
You can also see here the data that was used to create this chart. It is pretty apparent ghost peppers and Trinidad scorpion peppers are something we all should generally stay away from.
3 – To Remember
Always remember to take a look at the data! There are no two ways about it. Getting yourself in the habit of observing the data before believing any charts or analytics will prove to be immensely valuable to any aspiring data analyst. It has certainly helped me!
What’s next?
A big part of our jobs is to be aware of possible pitfalls in data analysis. So do not forget to share this video as widely as you can. And write your thoughts to us in the comments section below.
Youtube
And while you are at it… Check out all the great Excel videos on Oz’s Youtube channel. He’s on Fire.
- SSSVEDA DAY 7 – Every Team Needs Someone Who Understands Data - February 18, 2018
- SSSVEDA DAY 5 – When Data Analysis is Wrong - October 31, 2017
- SSSVEDA DAY 4 – Sharing the Excel Knowledge - July 18, 2017

Hey Oz, what´s SSSVEDA stand for?
SSSVEDA is 2 things:
VEDA is a general movement called Vlog EveryDay in April
I took on the challenge and successfully uploaded a video on about 24 of the 30 days in April
The SSS part refers to the person who led a bunch of us through the VEDA challenge. Her YouTube channel is SavvySexySocial.
Thanks for the question, Carlito!