
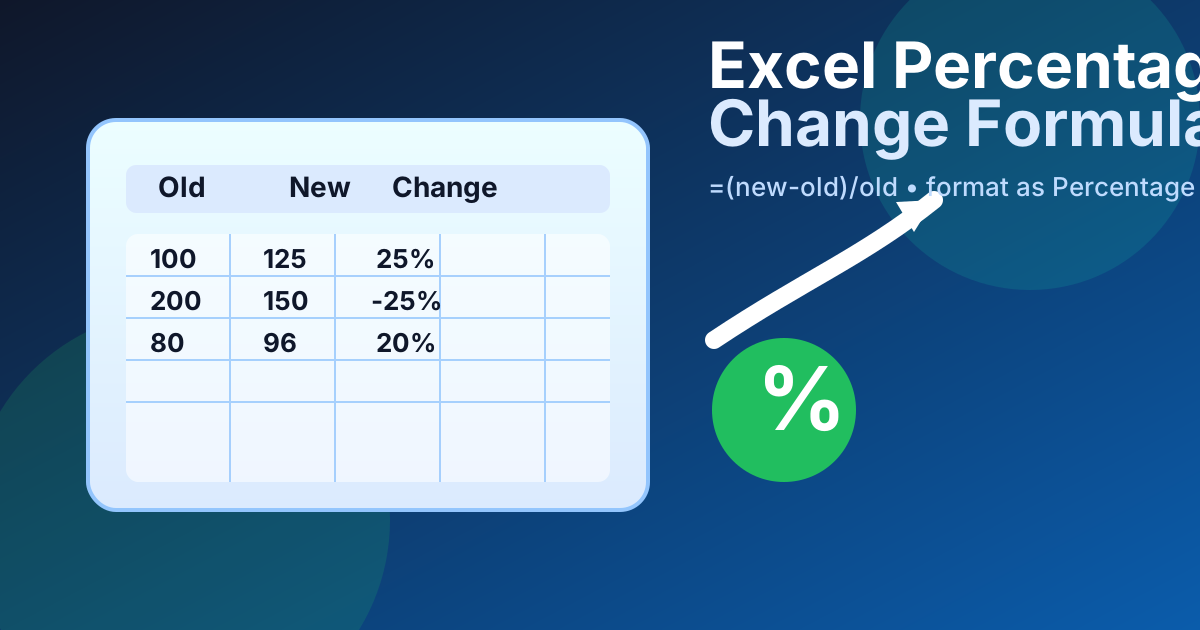
The Excel percentage change formula is =(new-old)/old. In a worksheet, that looks like =(B2-A2)/A2, where A2 contains the starting value and B2 contains the new value. Format the result cell as Percentage, and Excel will show the change in the way most people expect: 25%, -20%, 0%, and so on.
People often search for percent change, percentage difference, and percent decrease when they really need one of two Excel patterns: relative change from a starting point, or a symmetric comparison between two values. That one core formula covers most everyday use cases like sales growth, price changes, inventory movement, KPI tracking, and period-over-period comparisons. It is usually more useful than subtraction alone because the denominator tells you how big the move is relative to the baseline, not just how many units changed.
If you need the opposite operation, use the Excel subtraction formula. If you are averaging a column of percentages rather than measuring change, use Excel average formula percentage.
What the percentage change formula does in Excel
The percentage change formula tells you how large a change is relative to the original value. That makes it a better comparison tool than simple subtraction when the starting values differ in size. A 20-unit increase on a 100-unit baseline is much smaller than a 20-unit increase on a 40-unit baseline, and the percentage change formula makes that difference obvious.
The structure is simple:
=(new-old)/oldOr, if you are using cell references:
=(B2-A2)/A2The result is a decimal until you format the cell. So 0.25 is not wrong; it just means the cell still needs percentage formatting. That is why a clean percentage-change worksheet usually separates inputs, formula cells, and formatting.
A quick way to think about the formula is:
- New minus old = how much the value moved
- Divide by old = how large that move is relative to the starting point
- Format as Percentage = how Excel should display the answer
If the result is positive, the value increased. If it is negative, the value decreased. If it is zero, nothing changed. That logic is the same whether you are tracking a single product price or a long monthly report.
The exact Excel formula to use
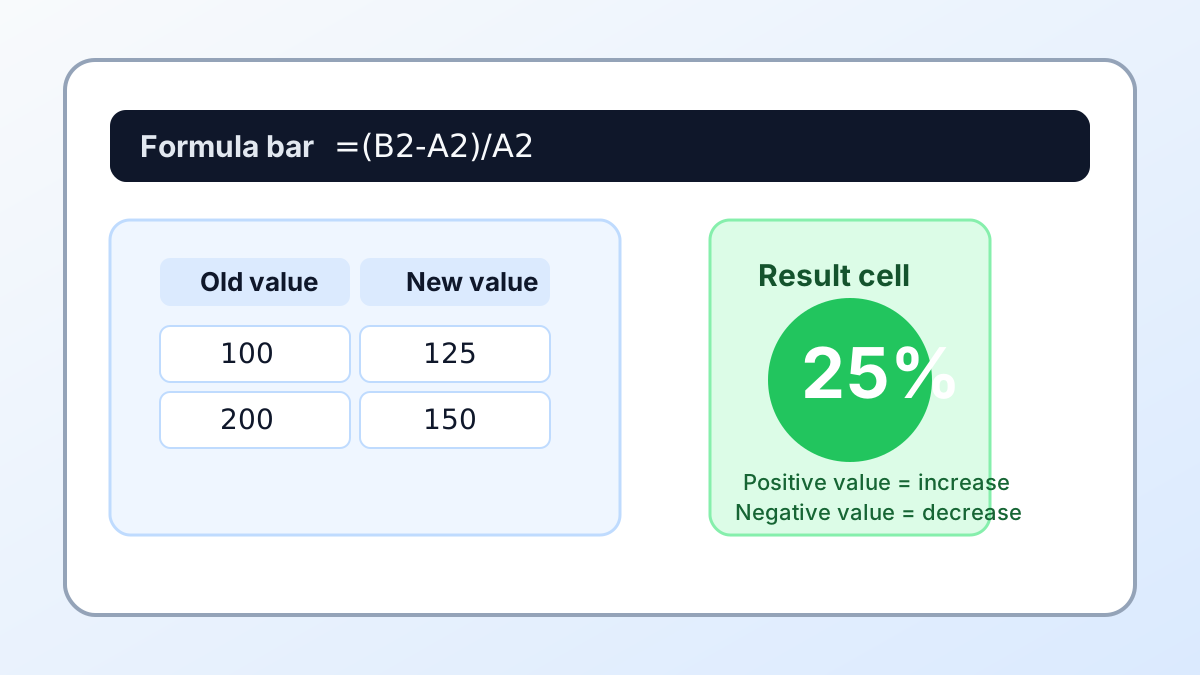
The best default formula is =(B2-A2)/A2 when A2 holds the old value and B2 holds the new one. That version is easy to copy down a column, easy to audit, and easy to explain. If your data is laid out the other way around, swap the references, but keep the logic: subtract the baseline, then divide by the baseline.
If you are entering it by hand, the workflow is:
- Put the old value in one column.
- Put the new value in the next column.
- Enter
=(new-old)/oldin the result column. - Format the result cell as Percentage.
- Copy the formula down if you have more rows.
Here is a small example:
| Old value | New value | Formula | Result |
|---|---|---|---|
| 100 | 125 | =(B2-A2)/A2 | 25% |
| 100 | 80 | =(B3-A3)/A3 | -20% |
| 50 | 75 | =(B4-A4)/A4 | 50% |
When the numbers are copied down a sheet, absolute references can help. For example, if all of your rows compare against one fixed baseline in A1, use =(B2-$A$1)/$A$1. The dollar signs lock the baseline so the reference does not shift as you fill the formula downward. That matters in dashboards, commissions sheets, and forecast models where one anchor value drives many comparisons.
A good habit is to keep the input cells in one block, the formula in an adjacent column, and the formatting visible at a glance. That makes it easier for another person to validate the worksheet later, especially if the file gets passed through finance, operations, or client reporting.
Percentage increase vs percentage decrease
The same formula handles both increase and decrease. You do not need separate formulas for growth and decline. If the new value is larger than the old value, the result is positive. If the new value is smaller, the result is negative. That is the real power of the formula: one calculation tells you direction and size together.
Examples:
- 100 → 120 =
=(120-100)/100= 20% increase - 100 → 90 =
=(90-100)/100= -10% decrease - 200 → 150 =
=(150-200)/200= -25% decrease
If you want the result to show only the magnitude, you can wrap the formula in ABS(). For example, =ABS((B2-A2)/A2) returns 25% instead of -25%. That can be useful when you care about size more than direction, but it also hides whether the value rose or fell. In reporting, that tradeoff matters: an executive summary may want magnitude only, while an operations report usually needs the sign.
A practical rule: keep the sign when you need diagnostic clarity, and remove it only when the direction is irrelevant. If you are building a weekly performance sheet, the signed version is usually the better default.
Percentage change vs percentage difference
Percentage change uses the original value as the baseline. Percentage difference is more symmetric: it compares two values without treating one as the permanent starting point. If you are comparing two similar prices, two test scores, or two measurements, percentage difference may be the better term.
A common percentage difference formula is:
=ABS(B2-A2)/AVERAGE(A2,B2)With 90 and 110, the difference is 20 and the average is 100, so the percentage difference is 20%. If you instead treat 90 as the old value and 110 as the new value, percentage change is about 22.2%. Same numbers, different question.
Use percentage change when you are tracking movement from one known starting point to a new value. Use percentage difference when you want a neutral comparison between two values. In other words, percentage change answers “how much did it move from here to there?”, while percentage difference answers “how far apart are these two numbers?”
If your report is about a metric growing from one period to the next, percentage change is usually the right choice. If your report is about closeness or variance between two measures, percentage difference is usually the better fit.
How to format percentage change correctly in Excel
Excel often shows the raw decimal first, and that can look confusing if you expect to see a percent sign right away. The fix is to format the result cell as Percentage after entering the formula. Once the cell is formatted, 0.25 becomes 25%, and -0.2 becomes -20%.
That matters because Excel stores percentages as decimals. Microsoft’s support docs note that 10% is stored as 0.1, and percentage formatting displays that underlying decimal as a percentage. So a result of 0.25 is the same as 25%; the cell just needs the right number format.
Sourced stat block
| Source | Fact | Why it matters |
|---|---|---|
| Microsoft Support | 10% is stored as 0.1, and percentage formatting displays the decimal as a percent. | Enter the formula first, then format the result cell as Percentage so the output reads as 25%, not 0.25. |
Source: Microsoft Support — Format numbers as percentages in Excel
Quick stat: In 2024, IBM reported that poor data quality costs organizations an average of USD 12.9 million each year. That is one reason spreadsheet formulas deserve careful checks. Source: IBM Think — What is data quality? (accessed 2026-07-18). A few formatting tips make the result easier to read:
- Use Percentage with one or two decimal places if you need precision.
- Use a custom number format if your report style requires a specific number of decimals.
- Keep the formula cell separate from the input cells so the logic is easy to audit.
- If you want to highlight gains and losses, add conditional formatting so positive values appear green and negative values appear red.
If you are building a sheet for other people, consider freezing the row with labels and adding a short note above the formula column. That tiny bit of context reduces mistakes later, especially when a worksheet gets reused months after it was created.
Using zero baselines, blanks, and ABS safely
The percentage change formula is straightforward until the baseline is zero. When the old value is 0, the percentage change is undefined because you cannot divide by zero. In that case, use a guard like =IF(A2=0,"",(B2-A2)/A2) so the cell stays blank instead of throwing an error. That is the safest default for most reports.
If you prefer a visible placeholder, you can return "N/A" instead of a blank. That is useful when a blank would be mistaken for missing data. The key is to be deliberate: zero baselines are not a cosmetic problem, they are a logic problem, and your formula should make that clear.
ABS() is helpful when you want magnitude only, but it can also hide the sign that tells you whether the value increased or decreased. For example, ABS(-0.25) and ABS(0.25) both display as 25%. That is fine for distance-style comparisons, but it is risky in trend reporting where direction is the whole point.
A final safety check: if your input cells are imported from another system, verify they are real numbers and not text that just looks numeric. Text values can make formulas fail or produce surprising results. Converting the column to numbers before calculating is usually the cleanest fix.
When to use this formula in real work
The percentage change formula is the right tool when the question is, “How much did this move relative to where it started?” That comes up constantly in budgeting, pricing, sales reporting, inventory tracking, and KPI dashboards. It is especially useful when raw changes are misleading because the underlying values live on different scales.
A few practical examples:
- Revenue grew from 80,000 to 92,000.
- Units sold fell from 1,200 to 1,050.
- A price changed from 49.99 to 59.99.
- A conversion rate moved from 2.4% to 3.1%.
In each case, percentage change gives a clearer answer than subtraction alone. A 12,000 revenue increase means something very different when it starts from 30,000 versus when it starts from 300,000. The percentage framing captures that difference instantly.
That is why the formula shows up in many of the Excel guides on this site, including the Excel subtraction formula and the Excel average formula percentage. Those posts cover the neighboring calculations, while this one focuses on the relative-change side of the workflow.
If your worksheet compares several periods, consider adding a helper column for the baseline period and a second helper for the difference itself. That layout makes it easier to audit the formula and easier to explain the result to someone who only wants the final percentage.
FAQ
These answers are short by design, but each one gives the exact formula or display rule you need. If you want a deeper refresher, jump back to the sections above for the worked examples, formatting notes, and zero-baseline guardrails at a glance.
How do I calculate percentage change in Excel?
Use =(new-old)/old. With 100 in the old-value cell and 125 in the new-value cell, the result is 25%. With 100 and 80, the result is -20%. The formula works for both increases and decreases, so one pattern covers every ordinary comparison.
How do I calculate percentage increase in Excel?
Use the same formula: =(new-old)/old. If the value goes from 100 to 150, the change is 50%. You do not need a separate increase formula because the positive result already tells you the value went up. That makes the spreadsheet simpler and easier to audit.
How do I calculate percentage decrease in Excel?
Use the same formula: =(new-old)/old. If the value goes from 100 to 75, the result is -25%. The minus sign is useful because it shows a decrease and the amount of the decrease at the same time. In trend reporting, that sign is often more informative than the magnitude alone.
What is the difference between percentage change and percentage difference?
Percentage change uses the old value as the baseline. Percentage difference is more symmetric and often uses the average of the two values. For example, 90 and 110 have a 20-point gap, but the percent answer depends on whether you are comparing from 90 to 110.
Why does Excel show 0.25 instead of 25%?
Because Excel stores 25% as 0.25. The formula output is correct; the cell just needs Percentage formatting. Once formatted, 0.25 displays as 25% and becomes easier to read in reports. That storage model is normal in Excel, and it is the same reason 10% is stored as 0.1.
