Sometimes we have analyze or sort through data all of which is in a single column. The problem occurs when not every entry in that column represents the same type of data. For example, you might have names, addresses, email IDs and so on, all in just one column. It is really difficult to analyze it without turning it into a grid. And there might be no way to extract the data in any other format from your source.
Don’t feel that you’re stuck! There is a way to save you from hours and hours of cut and paste. And this is exactly what Szilvia Juhasz (aka XSzil) is here to teach us today.
So, let’s begin.
1 – The Data In Excel Is Sometimes Ugly
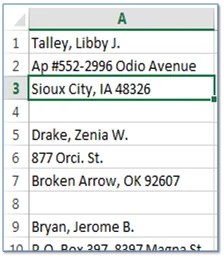
Suppose the data we have has name of a person, followed by address line 1 and address line 2. And it is all arranged in a three-line layout followed by one blank cell for each person in the data. An illustration of the data is below.
2 – The Setup – Create a Grid In Excel
The first step to converting the columnar data into a grid is a follows:
- Label columns of the grid with 1, 2 and 3. Yes, these represent the fact that each data point has 3 items.
- Label the rows using 0, 4, 8 and so on. It represents the cells each data point ends on.
While labeling the rows looks like a manual task, it actually isn’t. The fact that the data has the exact same layout means that the jumps will always be of 4. One can use Autofill to get the series in seconds.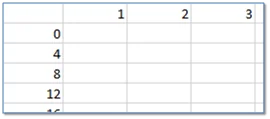
3 – Using The Index Formula In Excel
We now plug in the following formula in the cell corresponding to (0, 1) in our grid, and then drag it to cover the entire grid: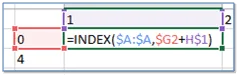
Note the following about the formula:
- We select the column with the 3-line data and turn its reference into an absolute one. This is to fix it when the data is dragged across.
- We fix the column of reference on 0, and the row of the reference on 1.
4 – The LookUp Results
It works! As you can observe in the image below, it picks up the names in column numbered 1, address line 1 in column numbered 2, and address line 2 in column numbered 3.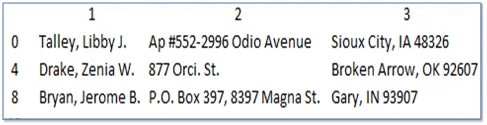
And there you have it, your columnar list in a grid, ready for cleaning, sorting and analysis.
What’s next?
Remember all that extracted data sitting in some forgotten folder? It is time to make use of it now that you know how to give it structure in seconds.
And do not forget to share this wonderful technique with your colleagues and loved ones.

Comments (1)
Historical comments preserved from the WordPress archive. Commenting is no longer active.
Yah,
This is a good way, i have used this type of data for example for teaching recording macros. This technique worked though. You guys are awesome