The 2016 Presidential Election Map is Now Available
This was first created 4 years ago during the 2012 presidential election cycle and takes advantage of the “Hover Over” method. The Map has been updated and is now available as a FREE Download here on Excel TV. Click the button below to download the file.
[thrive_link color=’teal’ link=’https://excel.tv/?tcb_lightbox=interactive-election-map-opt-in-page-for-blog-post-focus-area’ target=’_self’ size=’big’ align=’aligncenter’]Click to Download the FREE Excel Map[/thrive_link]
Once you have downloaded the file, follow the instructions below to orient yourself with the spreadsheet.
Step 1: Pick Your Starting Scenario
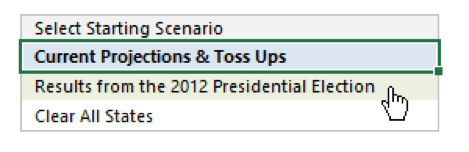 Hover over the scenario you’d like to start with and click it.
- Current Projections & Toss Ups – Current polling results based on the data from realclearpolitics.com captured on September 5, 2016
- Results from the 2012 Presidential Elections – State-wide results from the last US election
- Clear All States – States are cleared without being assigned republican or democrat
2. Understanding The Map
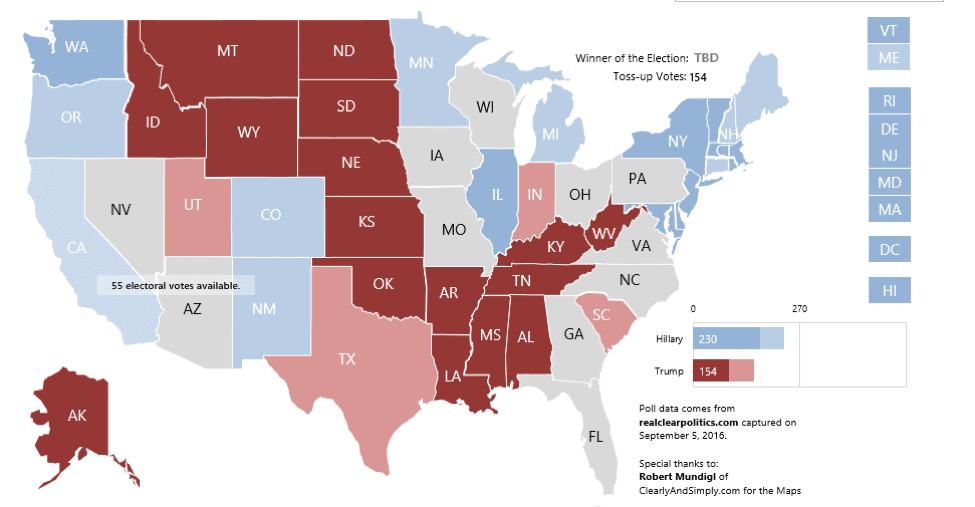
States are colored based on whether they are republican or democrat. As is standard in the United States, democrat states are blue; republican are red. When the Current Projects & Toss Ups scenario is selected, some states may have a lighter shade or red or blue indicating these states leaning toward one candidate/party. The two other scenarios do not include light shades for “leaning” states.
3. Using The Map
With a scenario selected, you are now ready to adjust the map to your predictions. You can change a state’s color by click on an individual state. Clicking on a state will allow you to toggle through three assignments:
- Blue – democrat
- Red – republican
- Gray – unassigned
That means if a state is blue and you click on it, it will become red. Click on it again and it will become gray. Click on it once more and it will become blue again, and so on.
Note: because you are assigning an outcome, you cannot set a state to be leaning with a lighter color.
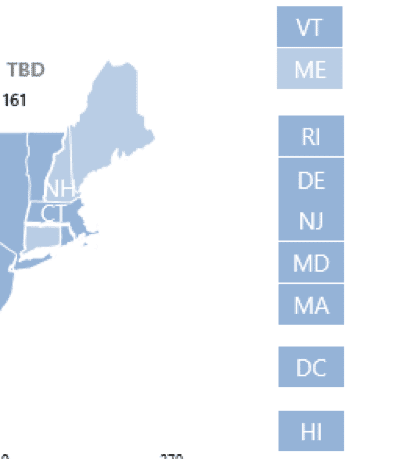
Some states are too small to click on directly. In these instances, we’ve included an additional box to click on the right side that will act as a proxy for state assignment. Click on these boxes to change how their respective states are assigned.
4. Predicting The Winner
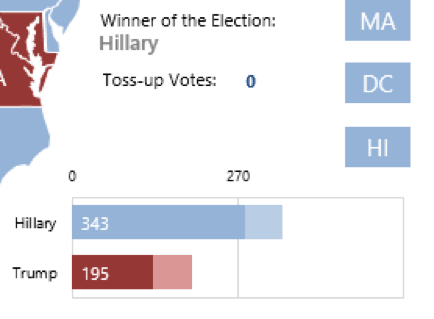
As you click each state, the chart at the bottom-right will let you know the current electoral college count and the amount needed to win the United States election. States that have not yet been assigned a winning political party will not be included in the chart. The total amount of electoral college votes belonging to these states are called “Toss-up Votes.” (see figure)
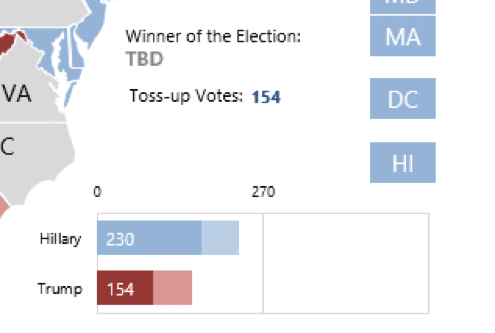
In the United States, to win election, a candidate must garner at least 270 electoral votes. A candidate (or political party) has won once they’ve crossed this threshold.
 Reselect a scenario to start over
- All Excel LOOKUPs Explained - May 26, 2020
- How to: Power Query File From Folder - April 21, 2020
- Oz’s Excel Tip: Keep a Workbook for Random Data in Excel - January 23, 2020
