
Short answer: the CAGR formula in Excel is =(Ending Value/Beginning Value)^(1/Years)-1. It converts a start value and an end value into a single annual growth rate, which makes it easier to compare performance across different time spans.
If you want a ready-made file, download the template workbook here: CAGR Excel template.
CAGR stands for compound annual growth rate. It turns a beginning value and an ending value into one annualized rate, which makes multi-year growth easier to compare.
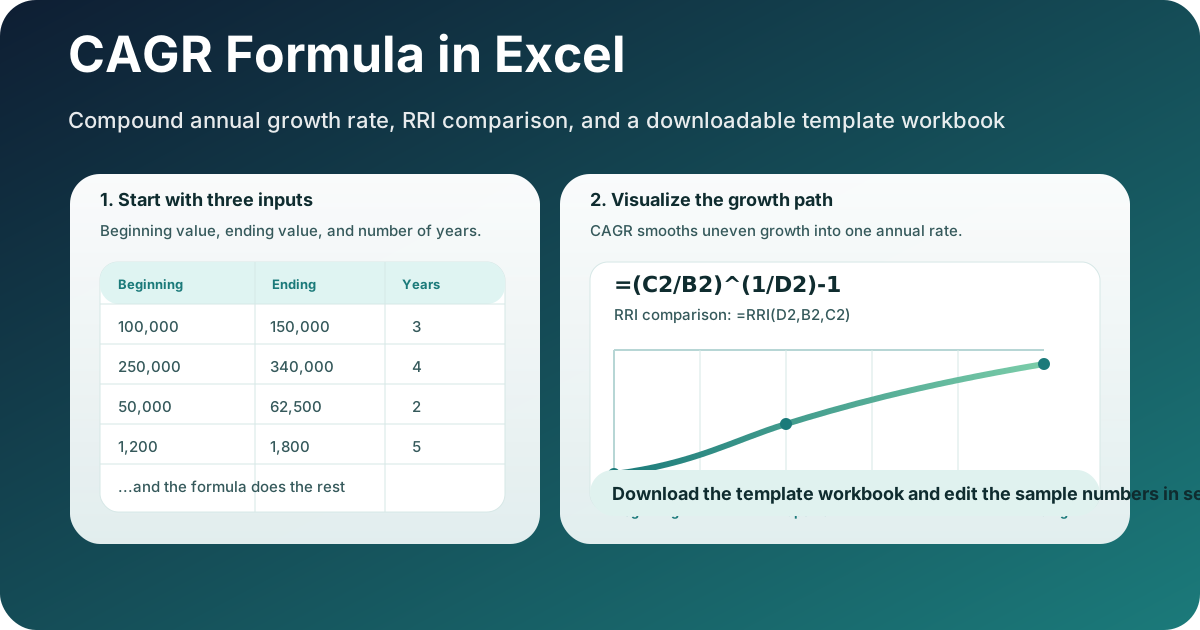
Key takeaways
- Use CAGR when you need one annualized rate from a beginning value, an ending value, and a number of years.
- The core Excel formula is
=(Ending Value/Beginning Value)^(1/Years)-1. - The RRI function returns the same kind of annualized growth rate with a shorter built-in formula.
- Average annual growth is not the same as CAGR unless every year grows at the same rate.
- The downloadable workbook includes sample inputs, helper formulas, and a comparison between CAGR, RRI, and yearly growth averages.
What is the CAGR formula in Excel?
The CAGR formula in Excel answers a simple question: if a metric had grown at a steady rate every year, what would that rate have been?
Here is the formula again:
=(Ending Value/Beginning Value)^(1/Years)-1If you prefer cell references, a common layout looks like this:
=(C2/B2)^(1/D2)-1Where:
B2= beginning valueC2= ending valueD2= number of years
That is the classic CAGR formula in Excel. It works best when the start and end values are positive and the time period is measured in whole years or a clean fractional-year input.
How do you calculate CAGR step by step in Excel?
The simplest way to calculate CAGR in Excel is to enter the start value, end value, and years, then use the formula and format the result as a percentage. In the template workbook, the inputs live in B2, C2, and D2, and the formula is =(C2/B2)^(1/D2)-1.
A good sample calculation looks like this:
| Beginning Value | Ending Value | Years | CAGR |
|---|---|---|---|
| 100,000 | 150,000 | 3 | 14.47% |
The math behind that example is =(150000/100000)^(1/3)-1, which equals about 14.47%.
If you are building a model for clients or internal reporting, I recommend keeping the inputs and the formula in separate cells. It makes the workbook easier to audit later, and it makes the logic obvious to anyone who opens the file.
What is the difference between CAGR, RRI, and average annual growth?
These three terms get mixed together all the time, but they are not identical.
| Metric | What it measures | Formula in Excel | Best use case |
|---|---|---|---|
| CAGR | Smoothed annual growth from start to finish | =(Ending Value/Beginning Value)^(1/Years)-1 | Comparing long-term growth across periods |
| RRI | Built-in Excel function for annualized growth | =RRI(nper, pv, fv) | Quick spreadsheet calculation with fewer manual formulas |
| Average annual growth | Arithmetic average of yearly growth rates | =AVERAGE(yearly growth range) | Reviewing year-over-year rates when each year matters individually |
CAGR
CAGR is geometric: it compounds from the beginning value to the ending value over the full time span, which makes it the best single summary rate for long-term growth.
RRI function
The RRI function is Excel’s built-in version of annualized growth:
=RRI(nper, pv, fv)If you enter the same inputs into RRI that you would use for CAGR, you usually get the same result. I like RRI when I want a shorter formula, but I still explain CAGR explicitly in articles and reports because the manual formula is easier for non-technical readers to understand.
Average annual growth
Average annual growth is usually an arithmetic average of yearly growth percentages. That can be helpful when each year matters on its own, but it is not the same as annualized growth from the beginning and end values.
When each one is better
Use CAGR for the headline metric, RRI for a shorter built-in formula, and average annual growth when you want to inspect the year-by-year swings.
If you need a cash-flow based annualized return instead of a simple start-and-end growth rate, read Excel XIRR vs IRR. If you need a bond return calculation, the How to Calculate Yield to Maturity in Excel guide is the better companion.
Why does CAGR matter in real Excel models?
CAGR matters because it helps you compare growth across different time spans without getting distracted by noise. A few common use cases:
- Revenue growth analysis
- Subscriber and user growth
- Asset value tracking
- Headcount planning
- Market size projections
- Product adoption trends
CAGR is especially handy in board decks and investor updates because it condenses a lot of history into one line. It is summary math, not a full narrative.
Quick stat: Microsoft says a single Excel worksheet can hold 1,048,576 rows and 16,384 columns. Source: Microsoft Excel specifications and limits. That is plenty of space for raw yearly values, helper columns, and growth checks inside one workbook.
How do I build the CAGR workbook template?
The workbook in this post shows the formula first, then the supporting logic, so you can inspect the cells and reuse the structure in your own model.
The template workbook includes:
- A clean input area for beginning value, ending value, and years
- A CAGR formula cell with percentage formatting
- An RRI comparison formula
- A yearly growth table for average annual growth
- Notes explaining when the values match and when they diverge
The point of the template is to keep the formulas visible and auditable.
Suggested workbook layout
| Cell | Label | Example |
|---|---|---|
| B2 | Beginning Value | 100000 |
| C2 | Ending Value | 150000 |
| D2 | Years | 3 |
| E2 | CAGR | =(C2/B2)^(1/D2)-1 |
| F2 | RRI | =RRI(D2,B2,C2) |
Then add a second section with yearly values:
| Year | Value | Growth |
|---|---|---|
| 1 | 100000 | — |
| 2 | 120000 | =B6/B5-1 |
| 3 | 115000 | =B7/B6-1 |
| 4 | 140000 | =B8/B7-1 |
Once those yearly growth rates exist, you can calculate average annual growth with:
=AVERAGE(C6:C8)That layout shows the difference between a single smoothed annual rate and the year-by-year arithmetic average. If you are teaching the concept to someone else, this is the easiest way to make the distinction obvious.
What mistakes should I avoid when using CAGR in Excel?
Most CAGR errors come from bad inputs rather than bad formulas. If the result looks strange, I usually check these issues first.
1. Using a zero or negative beginning value
CAGR needs a meaningful starting value. If the beginning value is zero, the formula cannot divide by it. If the beginning value is negative, the ratio can become nonsensical for a growth rate. In those cases, you need a different metric.
2. Mixing months and years
CAGR is annual. If your period is 18 months, do not type 18 as the year count. Convert the period into years, such as 1.5, or otherwise standardize your time input.
3. Confusing CAGR with a simple percent change
Simple percent change is just =(Ending-Beginning)/Beginning. That tells you total change. CAGR tells you annualized change over time. They are related, but they answer different questions.
4. Treating average annual growth like CAGR
Average annual growth is useful, but it is not a substitute for CAGR. If the yearly growth rates swing around, the arithmetic average can be misleading.
5. Forgetting to format the result as a percentage
Excel returns decimals by default. If you leave the cell in General format, the answer will look like 0.1447. That is correct mathematically, but it is not friendly for readers.
6. Using CAGR for volatile series without context
CAGR smooths volatility. That is the point, but it can also hide the path the data took. If a series had a crash and then a recovery, CAGR may make the full period look steadier than it really was.
How does CAGR compare with XIRR and YTM?
CAGR is a growth metric. XIRR and YTM are return metrics. They all use annualization, but they solve different problems.
- CAGR summarizes growth from a beginning value to an ending value.
- XIRR handles irregular cash flows with real dates.
- YTM estimates a bond’s return to maturity using coupon payments, price, and settlement details.
That means CAGR is best for simple growth stories, XIRR is best for uneven investments, and YTM is best for bonds. If you are modeling a business metric like revenue or users, CAGR is usually the right starting point. If you are evaluating an investment that has contributions and withdrawals, XIRR is more appropriate. If you are calculating a bond return, use YTM.
That is also why I keep the formulas separated in the spreadsheet. Mixing them into one block without labels makes the model harder to trust later.
Download the CAGR Excel template
The downloadable workbook below is designed to make the formula easy to reuse. It includes sample values, the manual CAGR formula, the RRI function, and a yearly growth section that shows how average annual growth differs from CAGR.
Download the CAGR Excel template
Inside the workbook you will find:
- Beginning value, ending value, and years input cells
- CAGR and RRI comparison formulas
- Year-by-year growth helper columns
- A small notes section explaining when to use each metric
- Formatting that makes the formulas easy to read
If you want to build your own version, start with the sample workbook and then replace the example numbers with your own data. That is the quickest way to turn a formula tutorial into a real working model.
FAQ
What is the CAGR formula in Excel?
The standard CAGR formula in Excel is =(Ending Value/Beginning Value)^(1/Number of Years)-1. It returns the annualized growth rate that connects a starting value to an ending value over time.
Should I use CAGR or the RRI function in Excel?
Use CAGR when you want the calculation to be obvious and easy to audit. Use RRI when you want a built-in Excel function that returns the same annualized growth rate from the same inputs.
Is average annual growth the same as CAGR?
No. Average annual growth is usually an arithmetic average of yearly growth rates, while CAGR is a geometric rate based on the beginning and ending values. CAGR is better when you want a single smoothed growth rate across multiple years.
What happens if the beginning value is zero or negative?
CAGR and RRI need positive starting and ending values to work cleanly. If the beginning value is zero or negative, use a different metric or restructure the model before calculating growth.
Can I use this CAGR template for revenue forecasting?
Yes. The workbook includes sample formulas you can adapt for revenue, subscriber growth, headcount, asset values, or any other metric that grows over time.
