
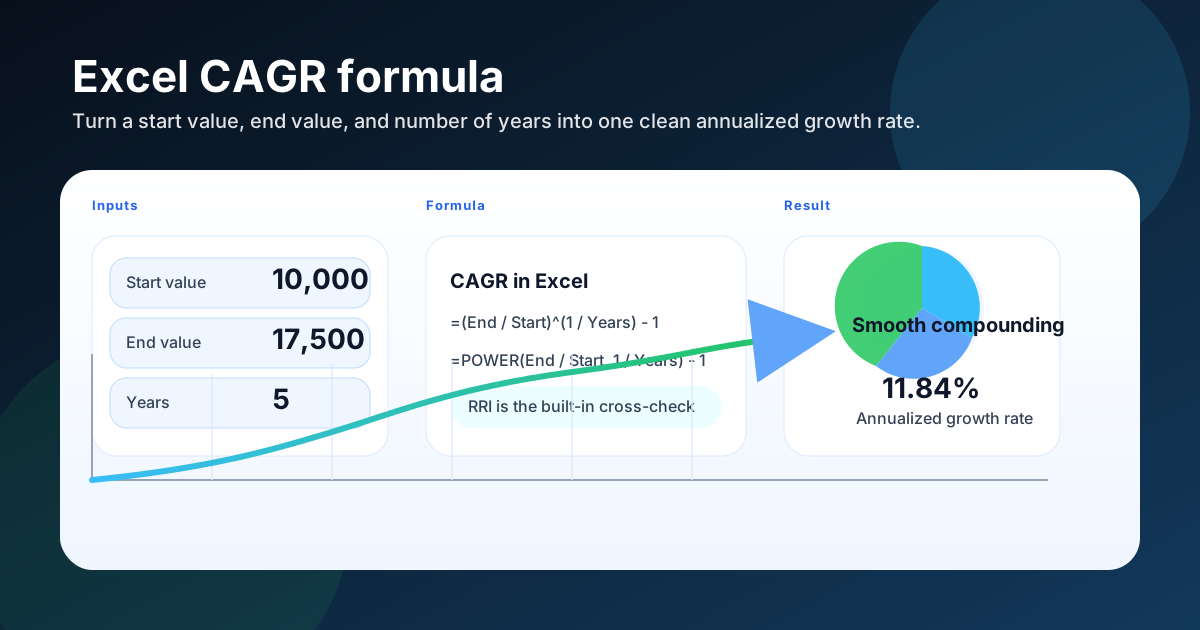
If you need a fast way to measure annualized growth in Excel, the CAGR formula is the one to use: =(End/Start)^(1/Years)-1. It takes the beginning value, the ending value, and the number of years, then smooths the change into a single yearly rate.
That makes CAGR useful for sales growth, revenue trends, customer counts, portfolio returns, and almost any other metric that moves over time. It is not a year-by-year story. It is the cleanest summary of how much something grew per year if the growth had happened at a steady pace.
Sourced note: Microsoft documents that one Excel worksheet supports 1,048,576 rows and 16,384 columns. That capacity can hold raw observations, helper columns, and a CAGR check in the same worksheet when a model needs more than a small example. Microsoft: Excel specifications and limits
Quick answer: if your start value is in B3, your end value is in B4, and the number of years is in B5, the Excel CAGR formula is:
=(B4/B3)^(1/B5)-1For a cleaner version, I often use:
=POWER(B4/B3,1/B5)-1And if I want a built-in cross-check, I use:
=RRI(B5,B3,B4)What is the Excel CAGR formula?
The Excel CAGR formula is just the standard compound annual growth rate equation written in spreadsheet form. In plain English, it asks: if a value started at one number and ended at another number over a certain number of years, what constant annual rate would produce that same result?
The core formula is:
=(Ending Value / Beginning Value)^(1 / Number of Years) - 1In Excel, the caret version and the POWER version return the same answer:
| Method | Formula | Best use |
|---|---|---|
Caret (^) | =(B4/B3)^(1/B5)-1 | Shortest formula |
| POWER | =POWER(B4/B3,1/B5)-1 | Easier to read |
| RRI | =RRI(B5,B3,B4) | Built-in check |
If your numbers are in a simple annual table, CAGR is usually the right metric. It gives you one rate that is easy to compare across companies, products, or time periods.
How do I calculate CAGR step by step in Excel?
The fastest way to calculate CAGR in Excel is to enter the start value, end value, and number of years in separate cells, then apply one formula to those cells. Keeping the inputs separate makes the calculation easy to audit, update, and explain when another person opens the workbook later.
Here is the example used in the downloadable template:
- Start value:
10,000 - End value:
17,500 - Years:
5
The formula is:
=(17500/10000)^(1/5)-1That returns 11.84%.
The worksheet setup I use
If I were building this by hand, I would lay it out like this:
| Cell | Label | Value |
|---|---|---|
| B3 | Start Value | 10000 |
| B4 | End Value | 17500 |
| B5 | Years | 5 |
| B7 | CAGR | =(B4/B3)^(1/B5)-1 |
| B8 | RRI Check | =RRI(B5,B3,B4) |
That layout keeps the logic obvious:
- Put the starting value in one cell.
- Put the ending value in another cell.
- Put the number of annual periods in a third cell.
- Calculate CAGR with a single formula.
- Cross-check the answer with
RRI.
Why the formula works
CAGR reverses compounding. If an amount grows by the same percentage every year, the end value is the start value multiplied by that growth rate repeatedly. CAGR solves the opposite problem: it takes the start and end values and backs into the constant rate that would connect them.
That is why the exponent is 1/Years. It spreads the total change evenly across the whole period.
Which Excel function should I use: POWER, caret, or RRI?
For most people, the POWER version balances readability and simplicity, while the caret version is shortest and the RRI function is a useful built-in cross-check. All three return the same annualized rate when they use identical positive inputs, so choose the version your workbook readers can audit most easily.
My practical rule is simple:
- Use
^when you want the shortest formula. - Use
POWERwhen you want the clearest formula. - Use
RRIwhen you want to verify the result.
RRI is especially useful when you are auditing a workbook and want to confirm that your manual CAGR math is correct. It returns an equivalent rate for a constant growth path, so the answer should match the manual formula if your inputs are the same.
If your growth dates are irregular, CAGR is not the right tool. In that case, compare this guide with my XIRR vs IRR walkthrough because XIRR handles uneven dates much better.
How is CAGR different from the RRI function and average annual growth?
CAGR, the RRI function, and average annual growth can all describe change over time, but they answer different questions. CAGR and RRI calculate the same geometric annual rate from endpoints, whereas average annual growth is usually an arithmetic average of each year’s percentage change and preserves the importance of yearly swings.
| Metric | What it measures | Excel formula | Best use |
|---|---|---|---|
| CAGR | Smoothed annual growth from start to finish | =(End/Start)^(1/Years)-1 | Comparing a clean multi-year change |
| RRI function | Built-in annualized rate | =RRI(nper,pv,fv) | Cross-checking the manual formula |
| Average annual growth | Arithmetic average of yearly growth rates | =AVERAGE(yearly growth range) | Reviewing individual year-to-year performance |
Use CAGR for the headline rate in a report and the RRI function when you want a compact formula that reaches the same result. Use average annual growth alongside them when the sequence of annual gains and losses matters. For example, volatile revenue can have a reasonable CAGR even when its yearly percentages vary sharply.
When should you not use CAGR?
CAGR is not the right metric for every dataset: it works best with one positive beginning value, one positive ending value, and a clearly measured time span. When values bounce around, cross zero, or come from irregular cash flows, another method can provide a more truthful and decision-useful result.
Here are the main cases where I avoid CAGR:
- Irregular dates or cash flows: use
XIRRor another date-aware return metric. - Zero or negative start values: the formula will break or become misleading.
- Very short periods: one unusual month or quarter can distort the annualized result.
- Highly volatile series: CAGR hides the path and only shows the endpoints.
That last point is important. CAGR is excellent for reporting, but it does not tell you what happened in the middle. A business could grow 50%, fall 20%, then recover again and still end up with the same CAGR as a smoother business.
If you need the full story, pair CAGR with a chart or a year-by-year table.
What mistakes cause CAGR formulas to fail?
The most common CAGR mistakes are simple cell-reference errors, mismatched dates, and unsuitable inputs. A zero, negative, or blank starting value cannot produce a meaningful conventional CAGR, and an incorrect number of annual periods changes the exponent. Check those inputs before treating any annualized result as a conclusion.
I see these problems most often:
-
Using the wrong period count
If you measured growth over 18 months but typed
1instead of1.5, the rate will be inflated. -
Mixing up start and end values
The formula assumes the first number is the beginning value and the second number is the ending value.
-
Forgetting to convert months into years
If the data is monthly, divide the months by 12 before you annualize.
-
Using CAGR on negative values
CAGR is not a fix for negative or zero values. In those cases, the math does not represent a useful growth rate.
-
Comparing CAGR to raw growth
Raw growth and CAGR are not the same. Raw growth is the total change. CAGR is the annualized equivalent.
If you want a monthly example, the logic is the same, but the exponent changes. For a monthly period count, annualize like this:
=(End/Start)^(12/Months)-1How do I calculate CAGR for monthly or quarterly data?
You can use CAGR with monthly or quarterly source data, but you must translate the elapsed periods into a yearly exponent before comparing the result with annual targets. Keep the unit of time explicit in the formula so a count of months or quarters is never accidentally treated as years.
For example:
- 12 monthly periods = 1 year
- 6 quarterly periods = 1.5 years
- 36 monthly periods = 3 years
If you have monthly data and want an annualized rate, the formula becomes:
=(End/Start)^(12/Months)-1If you have quarterly data, use:
=(End/Start)^(4/Quarters)-1The same idea applies to any period length. Convert the period count first, then apply the CAGR formula. That keeps the result comparable to annual targets and annual reports.
A simple check helps here: if the answer seems way too high or low, ask whether you counted periods correctly. A 24-month span is 2 years, not 24 years, and that mistake alone can throw the result off by a lot.
A quick side-by-side comparison
| Data type | What you count | Excel formula pattern |
|---|---|---|
| Annual | Years | =(End/Start)^(1/Years)-1 |
| Quarterly | Quarters | =(End/Start)^(4/Quarters)-1 |
| Monthly | Months | =(End/Start)^(12/Months)-1 |
How is CAGR different from average growth or year-over-year growth?
CAGR answers a different question from average growth or average annual growth. Average annual growth looks at the percentage change in each period and averages those results, while CAGR uses only the endpoints and elapsed time to calculate one compounded annual rate for the complete span.
That difference matters because the two numbers can disagree by a lot when the path is uneven. A business can spike early, flatten later, and still end with the same CAGR as a steadier business that grew every year.
Here is the practical way to think about the three metrics:
- Year-over-year growth shows what happened in each individual year.
- Average growth shows the average period change.
- CAGR shows the smoothed annual rate from start to finish.
If you need to explain a trend to a stakeholder, CAGR is usually the cleanest headline number. If you need to manage performance, year-over-year growth gives more detail. If you need to understand the middle of the journey, use both.
Worked example: three different ways to describe the same series
Imagine a metric that moves like this:
- Year 1: 10,000
- Year 2: 14,000
- Year 3: 13,000
- Year 4: 17,500
The year-over-year changes are messy, but the CAGR from Year 1 to Year 4 represents three annual growth intervals, not four. That rate still provides one annualized summary of the full series, which is useful in finance and operating reviews without pretending that the path was smooth.
How do I present CAGR in a report?
CAGR is most useful as one headline number that a manager, client, or investor can scan quickly, provided it stays connected to the underlying values. Pair the annualized rate with the actual start value, end value, and time span so readers understand the scale and context behind the percentage.
A good reporting line looks like this:
- Revenue grew from $10,000 to $17,500 over five years.
- That works out to an 11.84% CAGR.
- The year-by-year path still matters, so keep the supporting table or chart nearby.
If you are adding CAGR to a dashboard, I recommend showing three things together:
- The start value.
- The end value.
- The CAGR result.
That combination answers the obvious follow-up question: “11.84% of what, exactly?” It also keeps the metric honest, because CAGR alone can hide volatility. When a stakeholder can see the endpoints and the compounding rate side by side, the number becomes much easier to trust.
Download the Excel CAGR template
The downloadable workbook is a ready-to-use CAGR calculator with sample inputs, a manual formula check, an RRI check, and a simple growth projection table. Replace the sample values with your own positive start and end values plus an accurate period count to see the corresponding annualized result immediately.
Download the Excel CAGR template
The workbook includes:
- A calculator sheet with start value, end value, and years
- A manual CAGR formula
- An
RRIcross-check - A year-by-year projection table
- Formatting that makes the inputs and outputs easy to scan
FAQ
These short answers restate the formulas and input rules readers most often need when adapting the template. They supplement, rather than replace, the worked example above: use the manual formula or the RRI function with the same positive values and a period count measured in the correct units.
What is the formula for CAGR in Excel?
Use =(End/Start)^(1/Years)-1 or =POWER(End/Start,1/Years)-1.
Is RRI the same as CAGR?
For a clean start value, end value, and period count, RRI gives you the same kind of annualized result as CAGR.
Can I use CAGR for monthly growth?
Yes. Convert the period count properly before annualizing, or use a version of the formula that reflects the correct number of months.
Is CAGR better than average growth?
Usually yes. For positive values measured over equal periods, a simple arithmetic average equals CAGR only when every period’s growth rate is identical; otherwise, it overstates the equivalent compounded annual rate.
If you want a separate way to compare annualized growth with irregular returns, see my XIRR vs IRR guide and the yield to maturity tutorial.
