
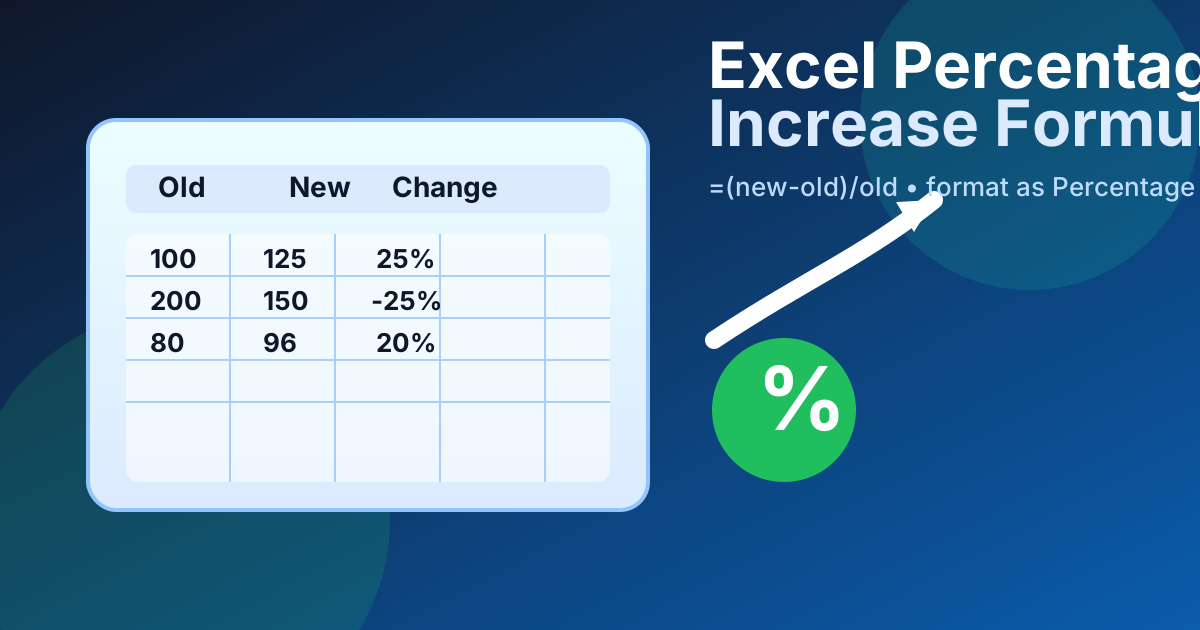
The Excel percentage increase formula is =(new-old)/old, which you’ll usually enter as =(B2-A2)/A2 when A2 is the starting value and B2 is the new value. If you just want to add a percentage to a number, use =value*(1+rate). In either case, format the result as Percentage so the answer reads cleanly.
This guide covers phrases like percent increase, add a percentage, and increase by percent. They point to two jobs in Excel: measuring growth and calculating a new value after an uplift.
If you also need the companion workflow for comparing two numbers in either direction, see Excel Percentage Change Formula. If you are averaging percentage values rather than increasing them, use Excel average formula percentage.
What the Excel percentage increase formula does
The Excel percentage increase formula tells you how much a value grew relative to its original size. That is better than subtraction alone when comparing values of different sizes. An increase from 20 to 30 is not the same as an increase from 200 to 210, even though both changes are 10 units.
The core formula is:
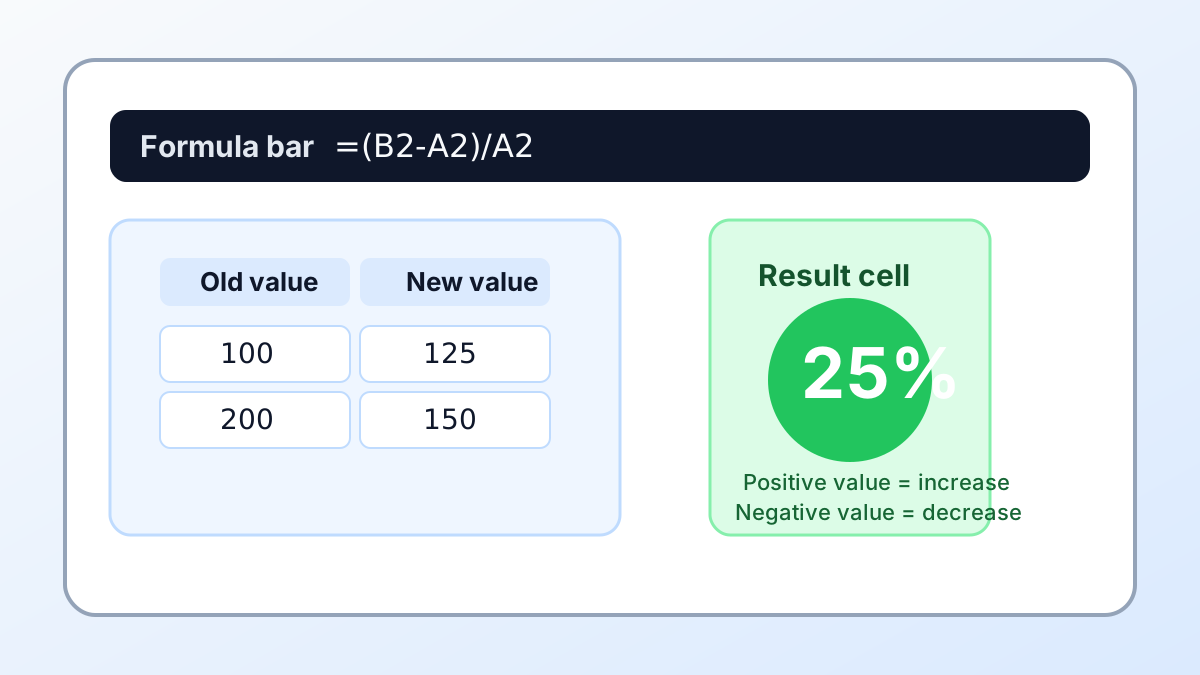
=(B2-A2)/A2Where:
- A2 = old value
- B2 = new value
- Result = percentage increase as a decimal until you format the cell
So if A2 is 100 and B2 is 125, Excel calculates (125-100)/100 = 0.25. Once you apply Percentage formatting, that displays as 25%.

A useful mental model is:
- Subtract the old value from the new value.
- Divide by the old value.
- Format the result as a percentage.
That sequence gives you both the size of the change and the baseline it was measured against.
How to calculate percent increase step by step in Excel
The most reliable way to calculate percent increase in Excel is to set up old and new values in separate columns and apply the formula in a third column. That keeps the sheet readable, makes auditing easier, and prevents accidental overwrite of your source data.
Here’s the simple setup:
- Put the starting value in A2.
- Put the ending value in B2.
- Enter
=(B2-A2)/A2in C2. - Format C2 as Percentage.
- Copy the formula down for the rest of the rows.
Example table:
| Old value | New value | Formula | Result |
|---|---|---|---|
| 100 | 125 | =(125-100)/100 | 25% |
| 80 | 100 | =(100-80)/80 | 25% |
| 250 | 300 | =(300-250)/250 | 20% |
The same formula works in a financial model, a sales report, or a pricing tracker. If your data changes frequently, storing the logic in a formula column is safer than typing the percentage manually.
If the values sit in a table, structured references can make the formula easier to read. For example, if a table has columns named Old Price and New Price, you can write a more descriptive version such as =([@[New Price]]-[@[Old Price]])/[@[Old Price]].
How to copy the formula down a column without breaking it
The safest way to scale a percentage increase formula is to use relative references for comparisons and absolute references when one input should stay fixed. That keeps the formula readable while preventing Excel from shifting the wrong cell as you fill it. If you understand which value should move and which should stay locked, the formula becomes easy to reuse.
For example, if every row compares against the value in A1, use =(B2-$A$1)/$A$1. The dollar signs lock the baseline, so copying the formula down produces =(B3-$A$1)/$A$1, =(B4-$A$1)/$A$1, and so on. That is especially helpful in dashboards, pricing sheets, and budget templates where one benchmark drives many rows.
You can also combine this with table formulas or the fill handle. If your data is already in a structured table, Excel automatically copies the formula through the column and keeps the logic consistent. That cuts down on manual edits and reduces the chance of a broken reference in row 47 when the sheet gets large.
How to add a percentage to a value in Excel
If your goal is not to measure growth but to add a percentage to a number, the simplest formula is =value*(1+rate). This is the formula you want for price markups, tax calculations, salary uplifts, and forecast scenarios where you know the starting value and the increase rate.
Examples:
=100*(1+10%)returns 110=250*(1+8%)returns 270=75*(1+15%)returns 86.25
If the percentage rate is in a cell, use a reference instead:
=A2*(1+B2)In that example, A2 contains the original value and B2 contains the percentage increase. If B2 is 0.15 or formatted as 15%, the formula returns a 15% increase over the base value.
This pattern is common in commercial spreadsheets because it answers a practical question: “What is the new total after a percentage increase?” That is different from “What is the percentage increase between two values?” The first formula generates the new number; the second formula measures the change.
How to format the result so Excel shows 25% instead of 0.25
Excel returns percentage math as a decimal first, so 0.25 is the same result as 25%. The formula is fine either way; the display changes when you apply Percentage formatting. If you skip formatting, the result looks wrong even when the calculation is correct.
Sourced stat block
| Source | Fact | Why it matters |
|---|---|---|
| Microsoft Support | Excel stores 10% as 0.1, and percentage formatting displays the decimal as a percentage. | If your formula returns 0.25, the cell is calculating correctly; it just needs Percentage formatting to display 25%. |
Source: Microsoft Support — Format numbers as percentages in Excel
A good formatting workflow is:
- Enter the formula first.
- Select the result cell.
- Choose Percentage from the Number group.
- Set the number of decimal places you want.
If your sheet is meant for stakeholders, a clean display matters. A result like 25.0% is easier to read than 0.25, and it reduces confusion when people copy the output into slides or reports.
How to handle zero, blanks, and negative values safely
The biggest technical risk in a percentage increase formula is dividing by zero. If the old value is 0, Excel cannot calculate a percentage increase because there is no valid baseline. In that case, use a guard so the sheet returns a blank or a message instead of an error.
A simple protection formula is:
=IF(A2=0,"",(B2-A2)/A2)You can also return "N/A" if that suits your report better:
=IF(A2=0,"N/A",(B2-A2)/A2)Negative values need a little more care. The formula still works mathematically, but the business meaning may be harder to interpret. For example, moving from -100 to -50 is an increase mathematically, because the number is rising toward zero. In many reports, that is still useful, but you should be explicit about what the metric represents.
Blanks are another common issue. If your input cells are empty, the result may also be blank or error-prone depending on the formula around it. For clean dashboards, it is often worth adding a guard that checks for both zero and blank values before calculating.
When to use percentage increase instead of percentage change
Use percentage increase when the new value is higher than the old value and you want the result expressed as growth. Use percentage change when you want one formula that covers both increases and decreases. The math is identical; the naming is what changes.
That distinction matters in reports. A sales dashboard might talk about percentage increase because it emphasizes growth. A KPI summary might use percentage change because it needs to show both gains and declines. If you want a single formula that handles both directions, =(new-old)/old is still the right answer.
A few practical examples:
- Revenue 1,000 → 1,250 = 25% increase
- Price 40 → 46 = 15% increase
- Orders 500 → 450 = -10% change, or a 10% decrease
If you are building a reusable worksheet, keep the formula generic and let the sign tell the story. That way the same column can show increases, decreases, and flat periods without extra logic.
Common mistakes that make the formula look wrong
Most percentage increase errors come from a handful of predictable mistakes. The good news is that each one has a simple fix, and once you know the pattern, you can spot the problem in seconds instead of rewriting the whole sheet. That matters when the workbook is shared or updated every week.
Using the wrong denominator
The denominator should be the old value, not the new one. If you divide by the new value, you are measuring something else and the answer will not match the expected increase.
Forgetting Percentage formatting
If the formula returns 0.25, that is not a wrong answer. It just means the cell still uses a general number format. Apply Percentage formatting and the display switches to 25%.
Mixing up increase and multiplication
=(B2-A2)/A2 measures the size of the increase. =A2*(1+rate) calculates the new total after you add a percentage. Those formulas answer different questions, so use the one that matches your goal.
Ignoring zero baselines
A zero starting value makes the percentage increase undefined. If that can happen in your data, add an IF guard before copying the formula down a long column.
Treating text as numbers
If a number imported from another system is stored as text, Excel may calculate incorrectly or not at all. Convert the data to real numbers first so the formula has something valid to work with.
Worked examples for prices, revenue, and rates
The easiest way to see the formula in action is to apply it to real business examples. The same logic works whether you are tracking pricing, revenue, subscriber counts, or conversion rates, and it gives you a quick check that the formula is behaving the way you expect before you copy it through a larger workbook.
Price increase example
If a product price moves from 49.99 to 59.99:
=(59.99-49.99)/49.99That returns about 20.0%. For retail, that is the most common use case: measure how much the price increased relative to the original price.
Revenue growth example
If monthly revenue increases from 80,000 to 92,000:
=(92000-80000)/80000The answer is 15%. That number is more informative than the raw difference of 12,000 because it shows the change in context.
Conversion rate example
If a conversion rate moves from 2.4% to 3.1%, the same formula works because Excel stores percentages as decimals. The increase is:
=(3.1%-2.4%)/2.4%That returns about 29.17%. In marketing, that can be a big deal because even a small absolute rate change can represent a large relative lift.
FAQ
How do I calculate percentage increase in Excel?
Use =(new-old)/old. If the value goes from 80 to 100, the result is 25%. If it goes from 200 to 250, the result is also 25%. The formula measures the change against the original value, not the final value.
What formula adds a percentage to a number in Excel?
Use =value*(1+rate). For example, 100 increased by 15% becomes 115, and 250 increased by 8% becomes 270. That formula is ideal for markups, budget planning, and any situation where you need the new total after a percentage uplift.
Why does my Excel percentage increase formula show a decimal?
Because Excel stores percentages as decimals. A result of 25% is stored as 0.25. Microsoft Support documents that 10% is stored as 0.1, so your formula is usually correct even when the display still needs Percentage formatting.
What if the old value is zero?
You cannot calculate percentage increase from zero because the formula divides by the starting value. Use a guard such as =IF(A2=0,"",(B2-A2)/A2) to prevent a divide-by-zero error. That keeps the worksheet clean and avoids confusing error values.
Is percentage increase the same as percentage change?
Percentage increase is simply percentage change when the new value is higher than the old one. A move from 200 to 250 is a 25% increase, while a move from 200 to 150 is a 25% decrease. The formula is the same; only the direction changes.
Final takeaway
If you want to measure growth in Excel, =(new-old)/old is the formula to remember. If you want to add a percentage to a value, use =value*(1+rate). Those two patterns cover most everyday spreadsheet jobs, from pricing and payroll to revenue reports and KPI dashboards.
For the related baseline comparison workflow, read Excel Percentage Change Formula. For percentage averaging and cleanup workflows, see Excel average formula percentage.
