
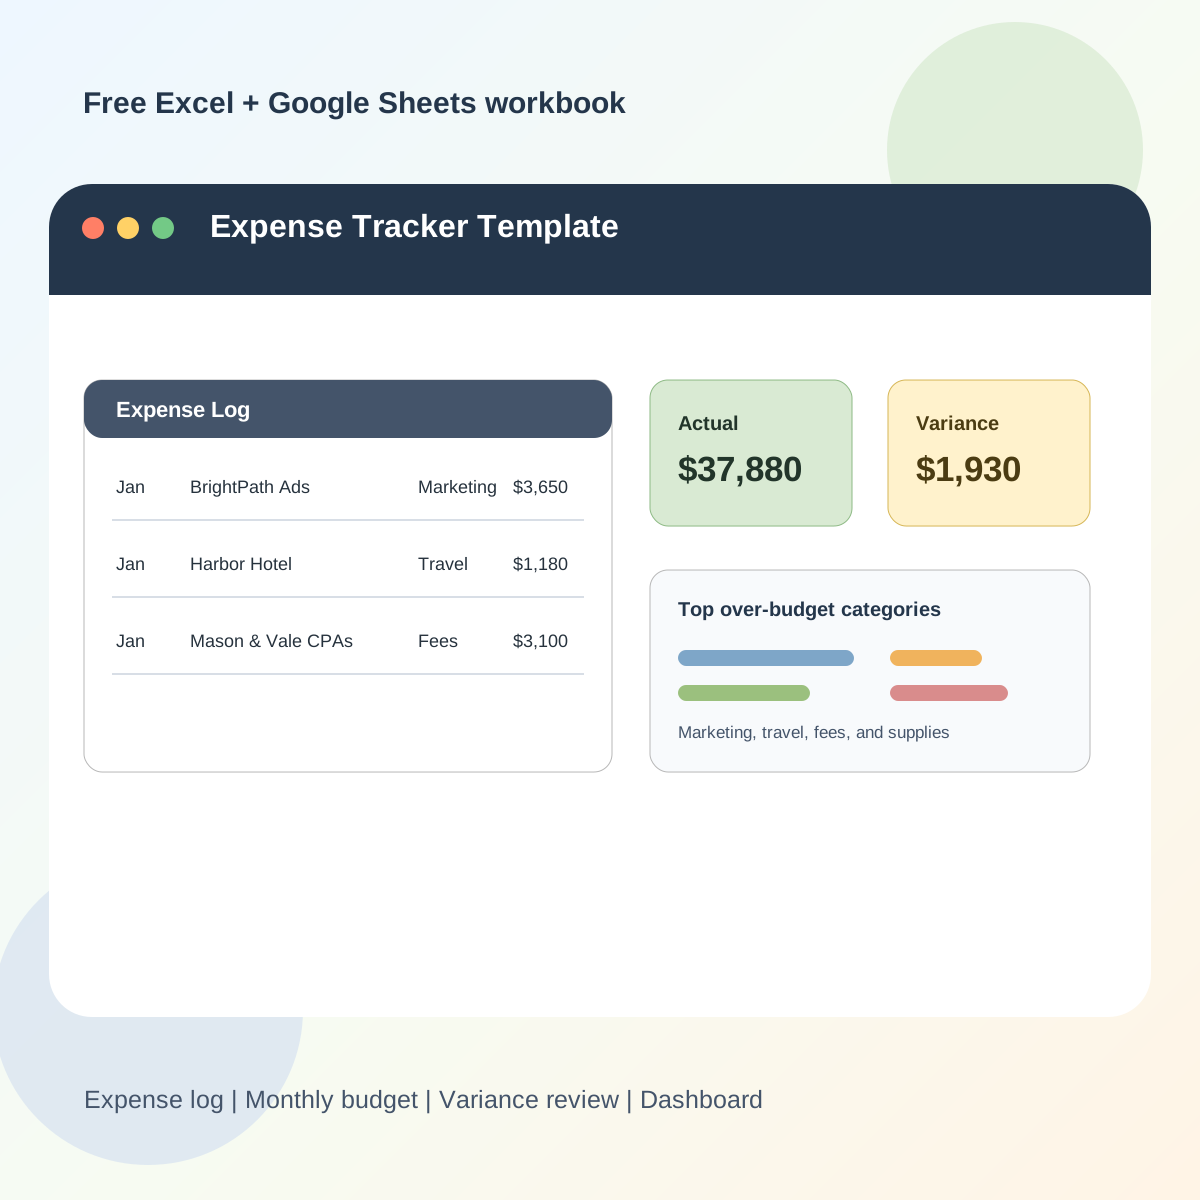
Every small business expense tracker I have rebuilt for someone starts with the same quiet mess: a card statement in one browser tab, a budget number in another file, a few ACH payments someone forgot to categorize, and a manager asking whether the month is actually over budget or just feels that way. This excel expense tracker template is built for that moment. It gives you one place to enter operating expenses, one place to maintain categories and monthly budgets, and one dashboard that tells you whether the selected month is on track.
Download the expense tracker template - it is a plain .xlsx file, no macros, no external data connections, no bank feed, and no sign-up. Open it in Excel or import it into Google Sheets and replace the synthetic sample data with your own expenses.
Who is this template for?
I built this for a business that needs a practical operating expense tracker, not a full accounting system. If you are trying to answer questions like “How much did we spend on software this month?”, “Which categories are pushing us over budget?”, or “How much of January spend cleared through ACH versus the card?”, this workbook is the right shape. It is especially useful for a founder, operations lead, bookkeeper, or department manager who wants a monthly budget review before the accounting close is fully packaged.
It is worth drawing the boundary clearly. This is not an employee expense report template. There is no mileage reimbursement section, no employee signature block, and no approval workflow. The job here is company-level expense tracking: rent, utilities, payroll, software, advertising, travel, supplies, professional fees, insurance, and any other operating categories you want to monitor against budget.
What’s in the workbook, sheet by sheet
The workbook ships with six sheets in this exact order:
- Instructions - setup steps, a color legend, Google Sheets notes, visible assumptions, limitations, and a clean-room disclosure that the workbook was authored from scratch for Excel.TV using synthetic data.
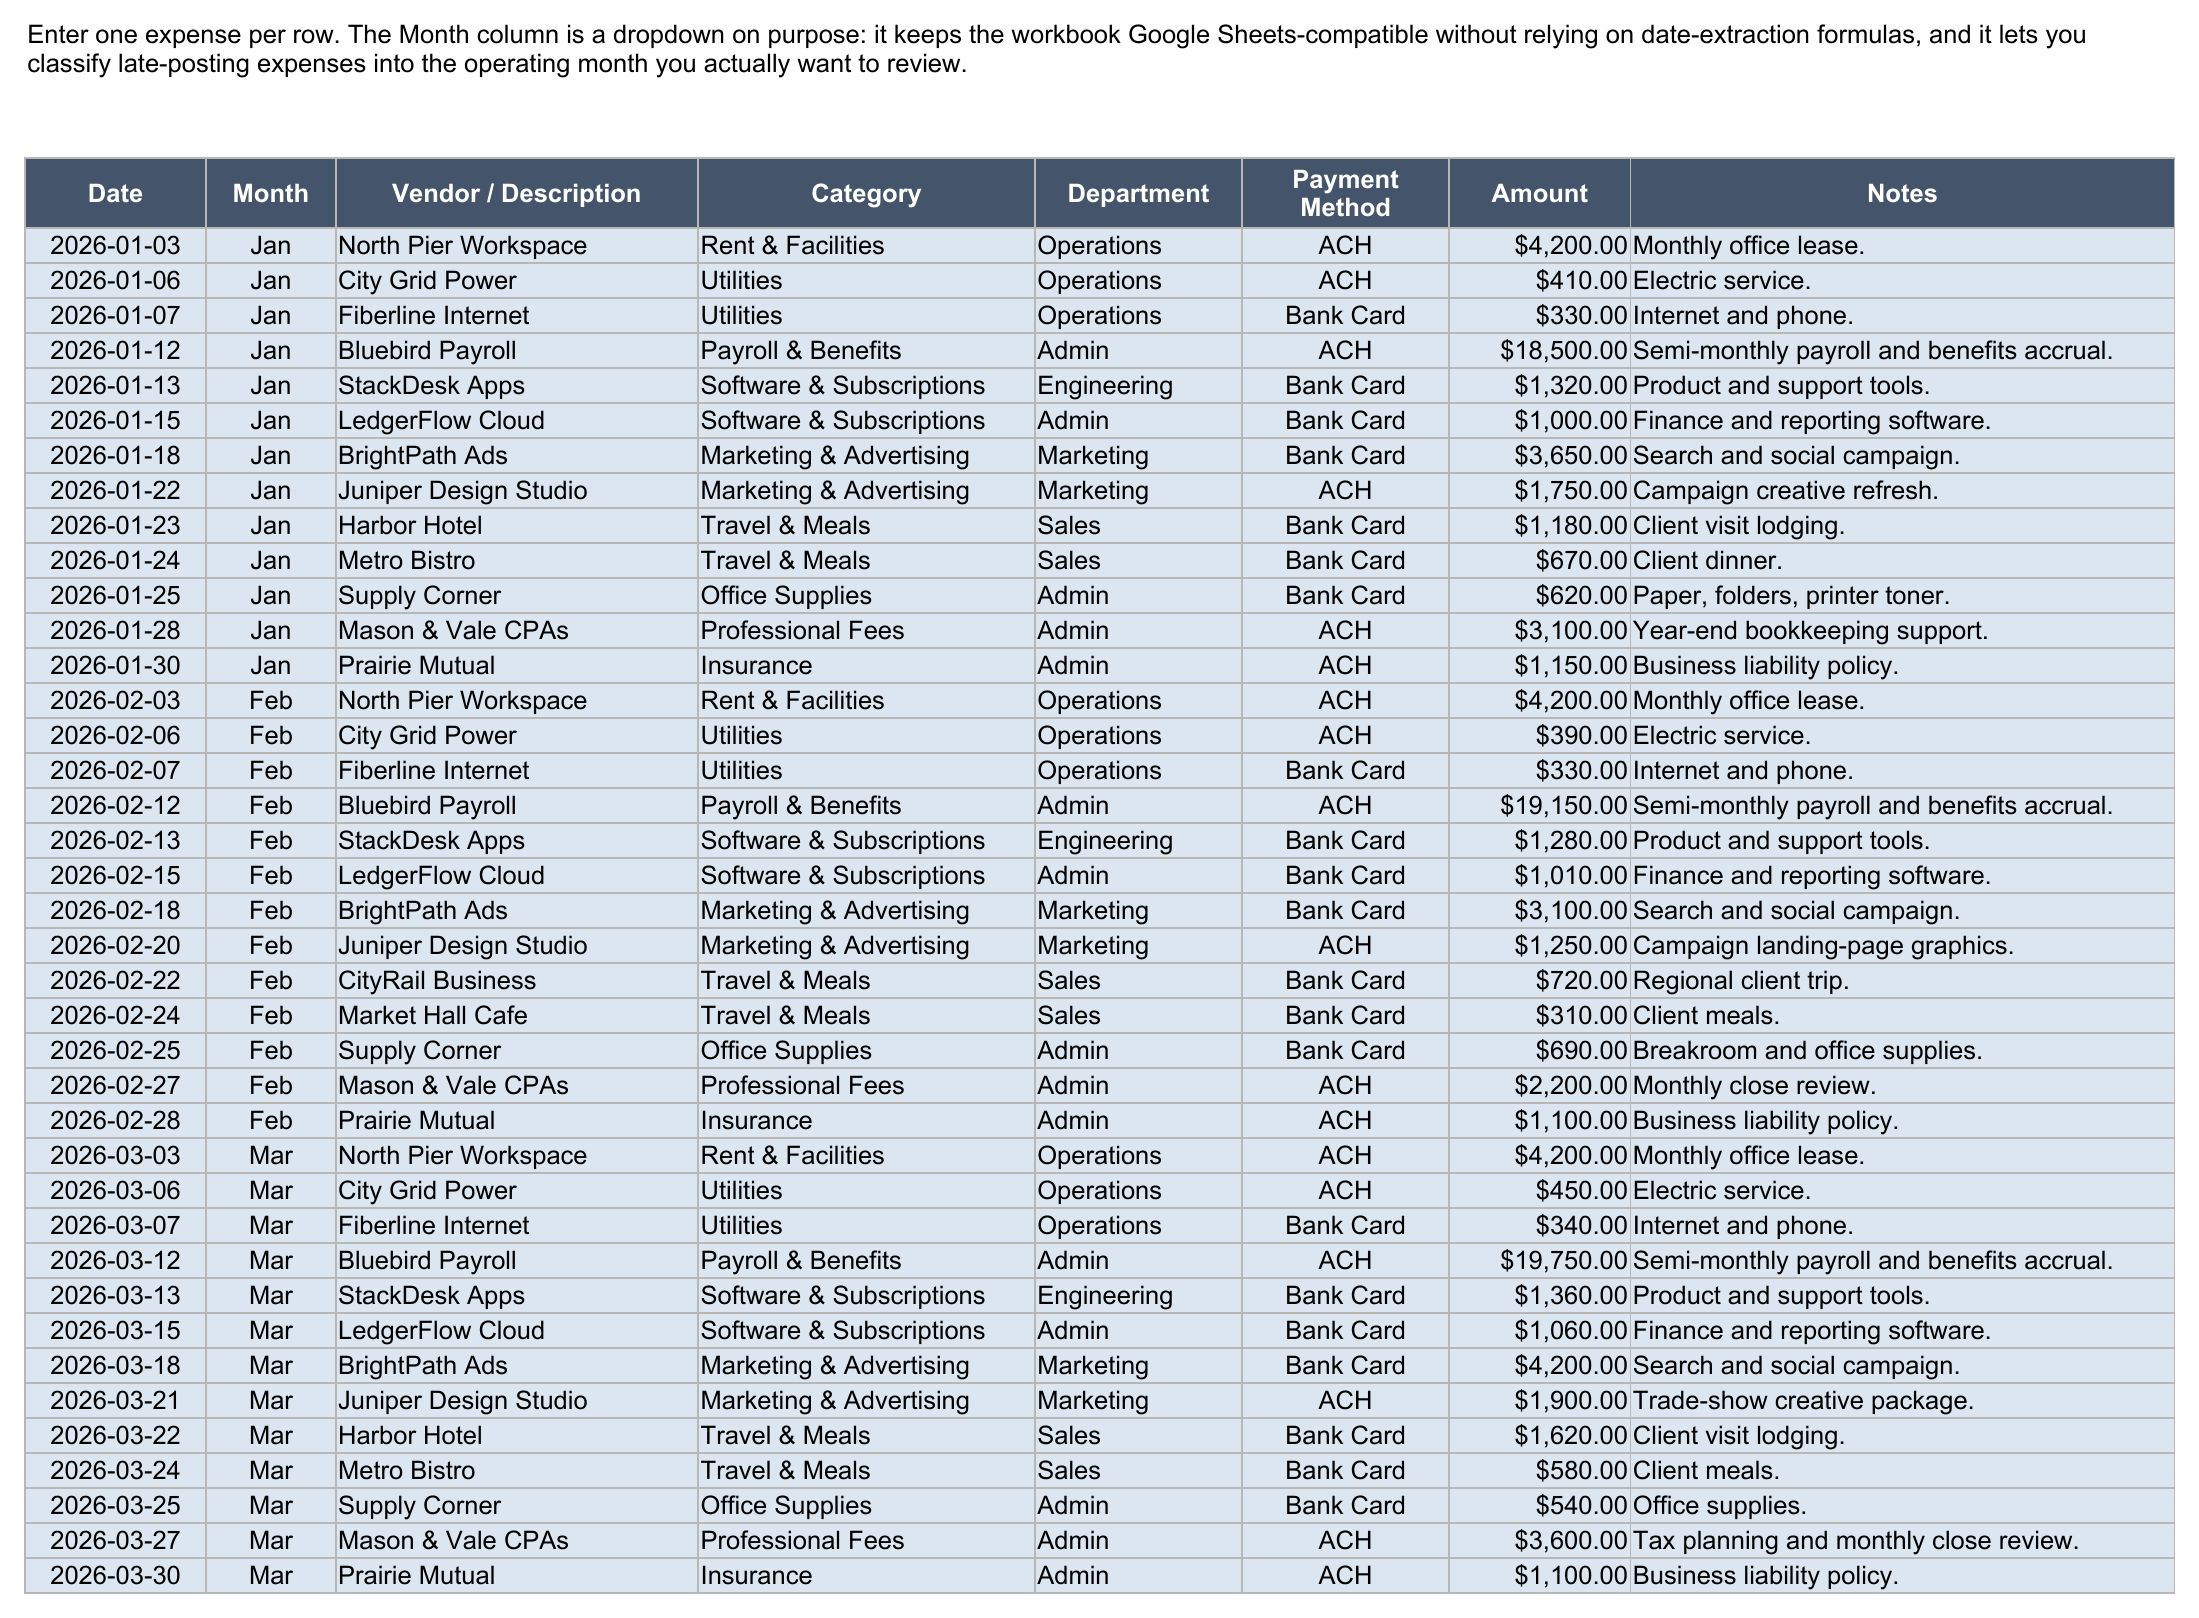
- Expense Log - the transaction-level input sheet. Each row has Date, Month, Vendor / Description, Category, Department, Payment Method, Amount, and Notes.
- Categories - the master category list with owner department, budget behavior, and notes. The category dropdowns are tied to this list.
- Monthly Budget - editable monthly budget amounts for Jan, Feb, and Mar, with a calculated Q1 Budget column.
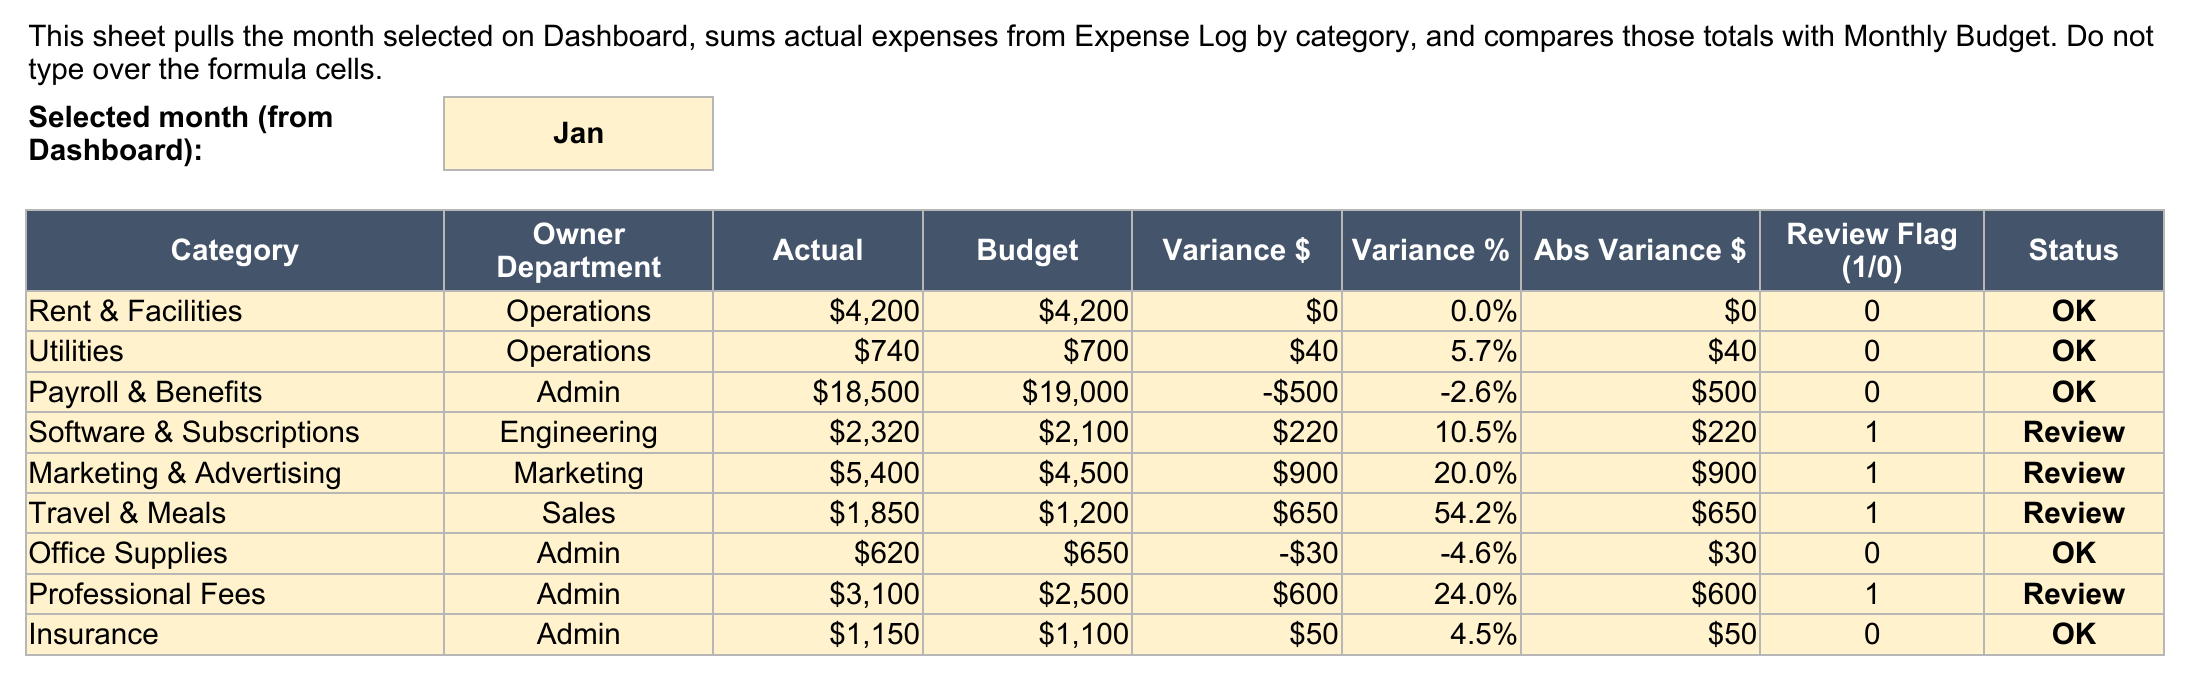
- Variance - a formula-driven category comparison for the month selected on Dashboard: actual, budget, variance dollars, variance percent, absolute variance, review flag, and status.
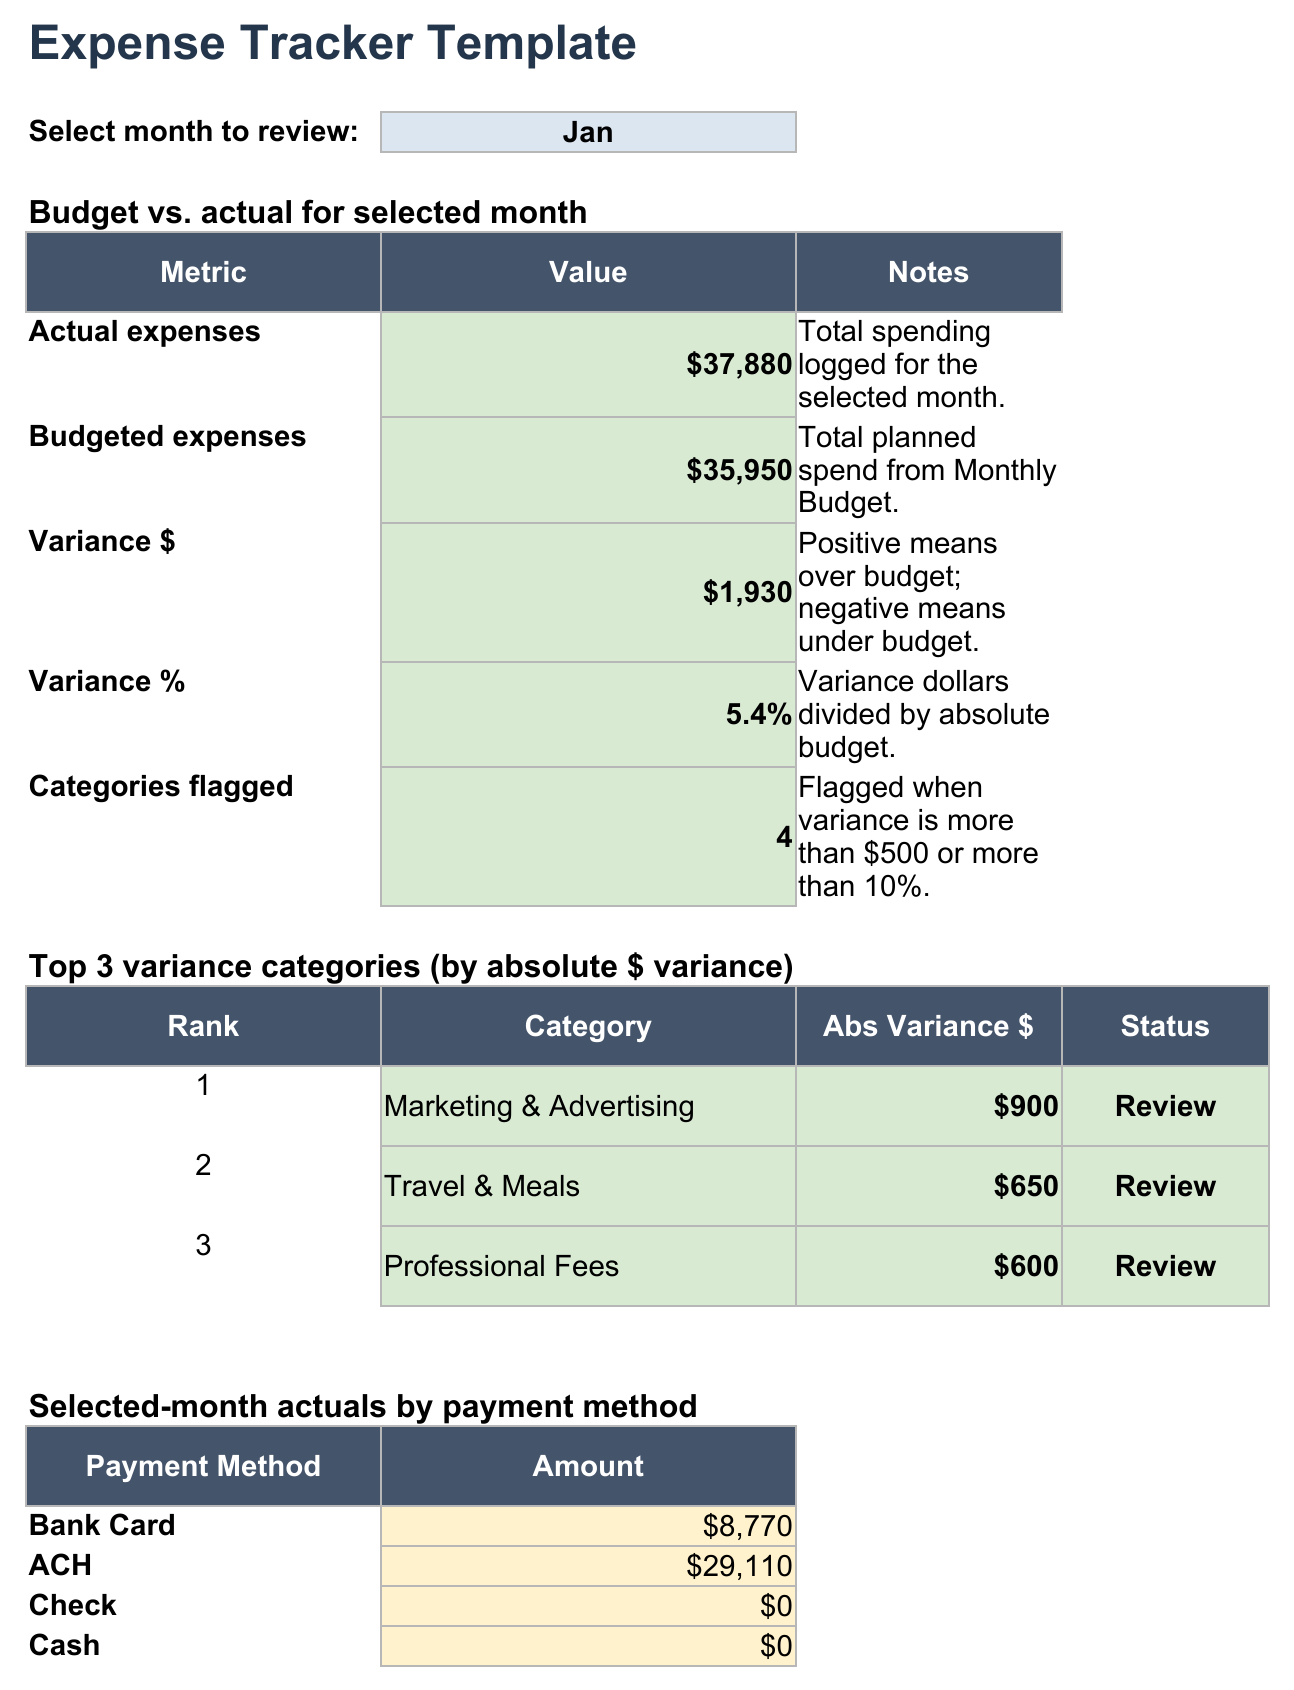
- Dashboard - a one-page view with the selected month, actual expenses, budgeted expenses, variance, flagged-category count, top three variance categories, and payment-method totals.
The required inputs are the expense rows on Expense Log, the category list on Categories, and the monthly budget amounts on Monthly Budget. The main outputs are the Variance sheet and the Dashboard. I color-coded the workbook using the shared Excel.TV template convention: blue cells are editable inputs, yellow cells are calculated formulas, and green cells are output results.
How to set up the expense tracker
Start with Categories. Replace the sample categories with your own operating expense structure, but keep each category name unique. I included common small-business categories like Rent & Facilities, Utilities, Payroll & Benefits, Software & Subscriptions, Marketing & Advertising, Travel & Meals, Office Supplies, Professional Fees, and Insurance because they make the sample model easy to audit. Your categories may be narrower or broader.
Then open Monthly Budget and enter the budget for each category by month. The Category column is editable, Owner Department is an INDEX/MATCH lookup from Categories, and Q1 Budget is a SUM formula. If you change a category name on Categories, update the matching category name on Monthly Budget and Variance so the formulas keep lining up.
Finally, enter expenses on Expense Log. The Month column is a dropdown instead of a formula derived from Date. I made that choice on purpose. Date formulas are not difficult, but the task of a business expense tracker is often classification, not calendar extraction. A late-posting card charge might have a February transaction date but belong in the January operating review. By choosing the Month explicitly, you control the month being analyzed, and the workbook stays simple in both Excel and Google Sheets.
How the variance formulas work
The most important formula in the workbook is on Variance. For each category, Actual is calculated with SUMIFS: sum the Amount column on Expense Log where Category matches this row and Month matches the selected month from Dashboard. Budget is a two-way INDEX/MATCH: match the category down the Monthly Budget rows and match the selected month across the Jan, Feb, and Mar headers.
From there, the math is intentionally plain. Variance dollars equals Actual minus Budget. Variance percent equals Variance dollars divided by the absolute value of Budget, wrapped in IFERROR so a category with a blank or zero budget does not throw a divide-by-zero error. Absolute Variance is ABS(Variance $). Review Flag is 1 when the category is more than $500 off budget or more than 10% off budget in either direction; otherwise it is 0. Status turns that flag into “Review” or “OK”.
I like this design because the workbook does not hide the decision rule. If $500 is too loose for your business, lower it. If 10% is too sensitive for a category with naturally uneven timing, raise it. The template gives you a starting point, not a rule you have to accept forever.
Worked example: reviewing January expenses
The sample data is synthetic, but I built it to behave like a real operating expense review. In January, the Dashboard is set to Jan and recalculates to these values:
| Metric | Recalculated value |
|---|---|
| Actual expenses | $37,880 |
| Budgeted expenses | $35,950 |
| Variance $ | $1,930 |
| Variance % | 5.4% |
| Categories flagged | 4 |
The top three absolute variances for January are also pulled straight from the workbook: Marketing & Advertising at $900, Travel & Meals at $650, and Professional Fees at $600. Marketing & Advertising is the clearest overage: $5,400 actual against a $4,500 budget, which is a 20.0% variance. Travel & Meals is $1,850 actual against a $1,200 budget, and Professional Fees is $3,100 actual against a $2,500 budget. Those three categories explain $2,150 of unfavorable movement by themselves, partly offset by Payroll & Benefits coming in $500 under budget.
The payment-method totals help with a different kind of review. For January, the Dashboard shows Bank Card spend of $8,770 and ACH spend of $29,110. That tells me where to reconcile first: most of the dollars cleared through ACH because rent, payroll, professional fees, and insurance are large fixed or semi-fixed operating payments, while card spend is more concentrated in advertising, software, travel, utilities, and supplies.
That is the point of the template. I do not want a dashboard that merely says “over budget.” I want it to tell me where the overage lives, whether the category is big enough to review, and whether I should start with the card statement or the ACH register.
How to use the monthly budget sheet
Monthly Budget is deliberately boring, because budget inputs should be easy to review. Each category gets one row, each month gets one editable budget cell, and Q1 Budget totals Jan through Mar. The sample January budget totals $35,950 across the nine categories. February is $36,870. March is $38,530. You can replace all of those numbers with your own planned spend, then use the Dashboard month selector to compare actuals against whichever period you are reviewing.
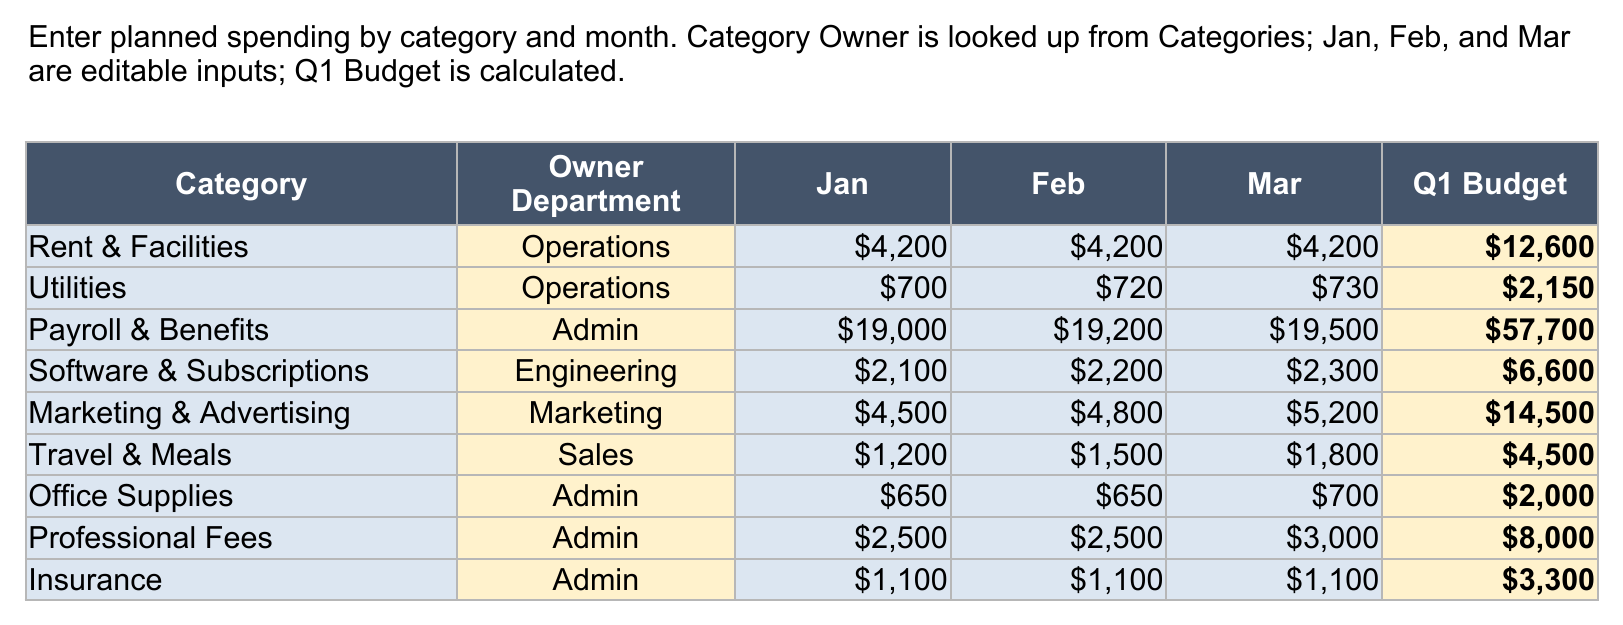
If you run a department budget, you can treat Owner Department as the person or team accountable for the category. If you run a very small business, you might use Owner Department simply to split Operations, Sales, Marketing, Engineering, and Admin. Either way, keep the category names stable. The formulas depend on exact category matches, so “Software” and “Software & Subscriptions” are different categories unless you rename them consistently everywhere.
How do I use this in Google Sheets?
Google Sheets is a first-class destination for this google sheets expense tracker template. Open Google Sheets, choose File > Import > Upload, select the downloaded .xlsx, and choose Insert new sheet(s). The formulas use only SUM, SUMIFS, IF, IFERROR, INDEX, MATCH, ABS, ROUND, LARGE, and arithmetic, all of which are supported natively in Google Sheets. No formula substitutions are required.
The data validation dropdowns import too: Month, Category, Department, Payment Method, and the Dashboard month selector. After import, use the Dashboard selector the same way you would in Excel. If you prefer to keep the workbook as a native Google Sheet after importing, use File > Save as Google Sheets or simply keep working in the converted Sheet Google creates during import.
If you would rather skip the download-and-import step, make a copy of the Expense Tracker Template in Google Sheets. Google will prompt you to save it to your own Drive, and from there it works like the Excel version: same sheets, same dropdowns, same variance review, and same dashboard.
Limitations to know before you rely on this
A few constraints are visible in the workbook because I would rather have you know them before you build a process around it:
- This is cash-basis tracking, not accrual accounting. It tracks expense rows by selected month and category; it does not post journal entries, amortize prepaid expenses, or produce financial statements.
- The Month field is manual. That is intentional for portability and control, but it means a user can classify a transaction into the wrong month if they pick the wrong dropdown value.
- There are no receipt attachments. Keep invoices, receipts, and card documentation in your normal file system or accounting tool.
- The top-3 ranking does not break ties. The
LARGEplusMATCHpattern returns the first category with a matching absolute variance if two categories tie exactly. - Adding months requires formula maintenance. Extend Monthly Budget, update the Dashboard selector list, and expand the formulas that point at the month headers.
- No macros or external connections. That is deliberate. It keeps the workbook portable between Excel and Google Sheets.
Download the expense tracker template and start by replacing the sample categories, budgets, and expense rows with your own. Once those three inputs are clean, the variance review and dashboard will follow.
