
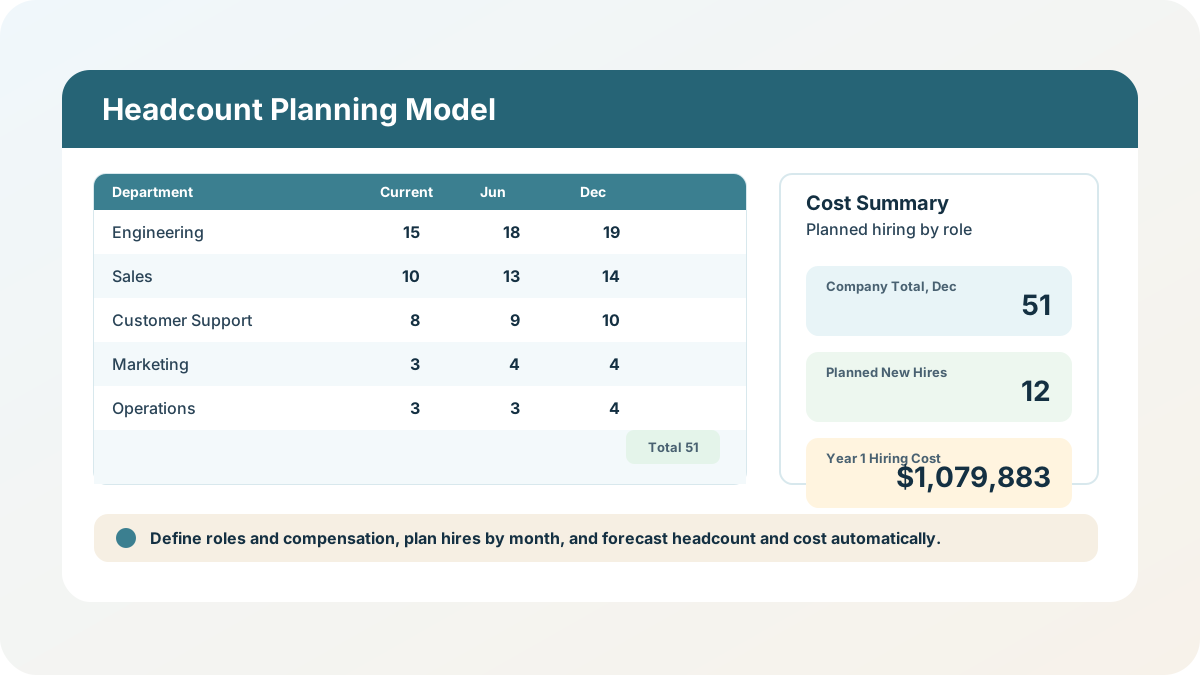
Most headcount spreadsheets I see are really two disconnected documents stapled together: an org chart that shows who exists today, and a hiring wishlist that nobody has actually costed out. Neither one answers the question a CFO or a department head actually asks in a planning meeting — if we make every hire on this list, what does headcount look like in December, and what does it cost between now and then? This headcount planning template excel workbook is my attempt to close that gap in one file: roles, compensation assumptions, a month-by-month hiring plan, and a headcount and cost forecast that all reconcile against the same numbers.
Download the headcount planning model — it’s a plain .xlsx, no macros, no external data connections, no video gate, and no sign-up. Open it in Excel or import it into Google Sheets and replace the synthetic sample roles and hires with your own.
Who is this template for?
I built this for the finance partner, HR business partner, or department leader who owns a staffing plan and needs to defend it with numbers, not a headcount target pulled out of thin air. If you only need a simple org chart or a completion checklist, this is more workbook than you need. This one is for the planning cycle where someone is going to ask “how many people will we have by Q4, and what will it cost us to get there” and you need an answer that holds up when the assumptions change — which is really what workforce planning comes down to once you get past the org chart.
That is why I kept compensation assumptions, hiring timing, and cost as three separate, connected modules instead of one hand-typed headcount number per department. A useful workforce budget template should let you change one assumption — a start month slips, a benefits load percentage moves, a role gets cut — and watch the forecast and the cost roll up correctly without re-deriving anything by hand.
What’s in the workbook, sheet by sheet
The workbook ships with six sheets, in this exact order:
- Instructions — setup steps, a colour legend, Google Sheets import notes, limitations, and a clean-room disclosure: every formula, layout, sample role, compensation figure, planned hire, and forecast number in this workbook was authored from scratch for excel.tv. No vendor workbook, template, branding, or sample dataset was downloaded, inspected, or adapted.
- Roles — the master role list: Role ID, Role Title, Department, Level, Employment Type, Current Headcount, and Notes.
- Compensation Assumptions — base salary, bonus %, benefits load %, employer tax %, and one-time recruiting cost per Role ID. Role Title and Department are looked up automatically, and Fully Loaded Annual Cost is calculated from the inputs.
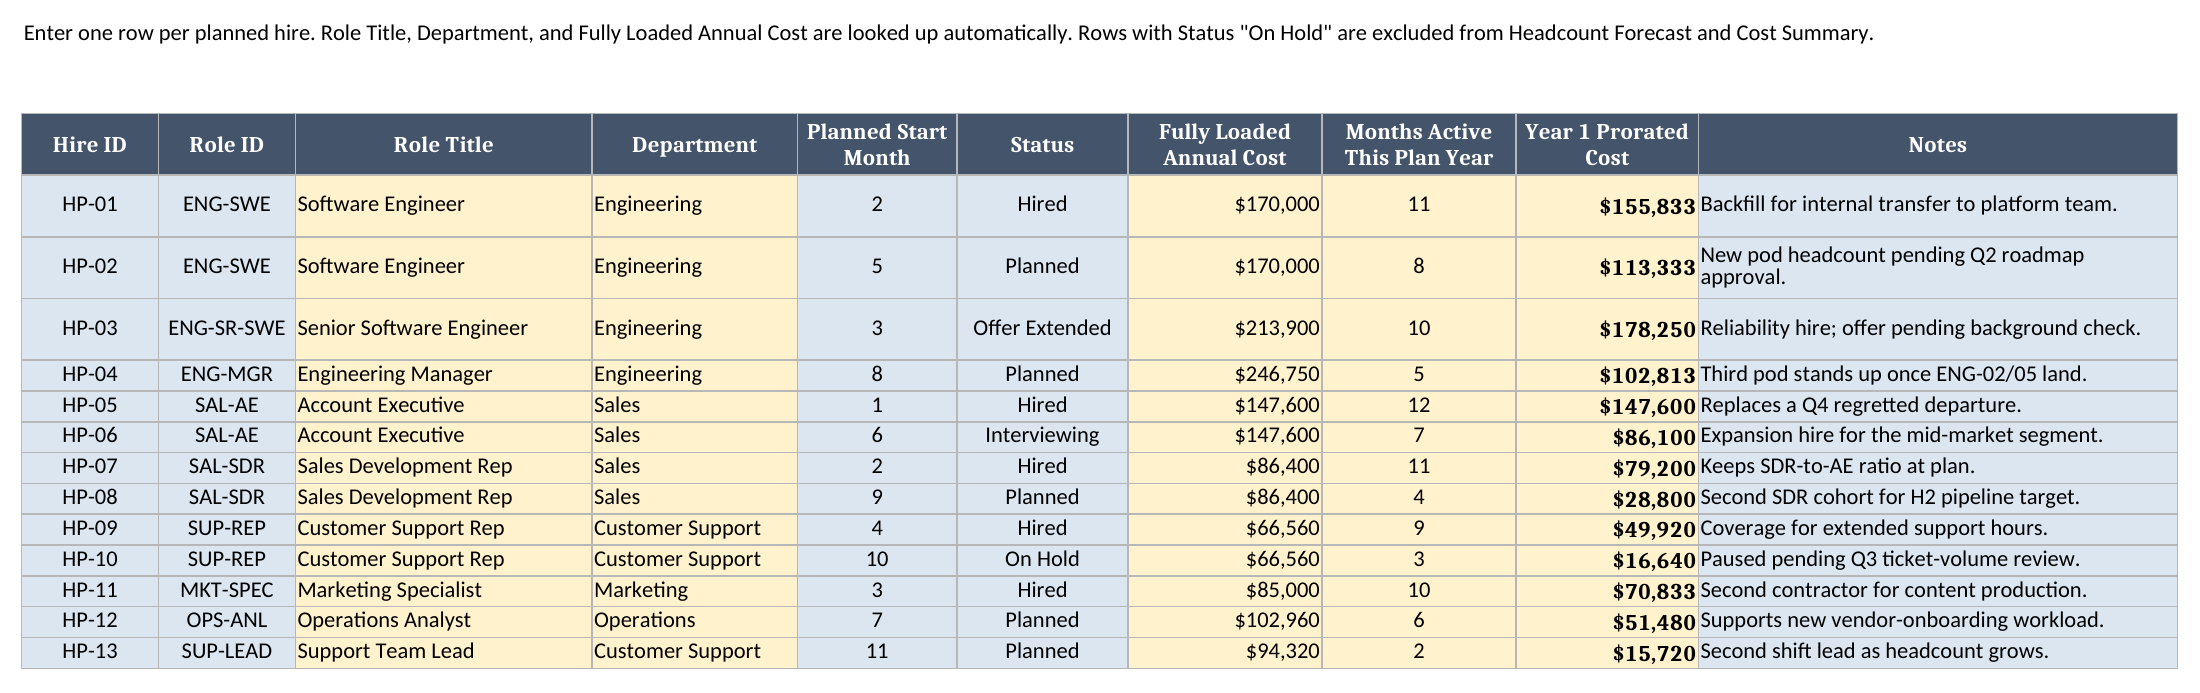
- Hiring Plan — one row per planned hire: Role ID, planned start month, and status. Role Title, Department, and Fully Loaded Annual Cost are looked up automatically, and Year 1 Prorated Cost accounts for a partial first year.
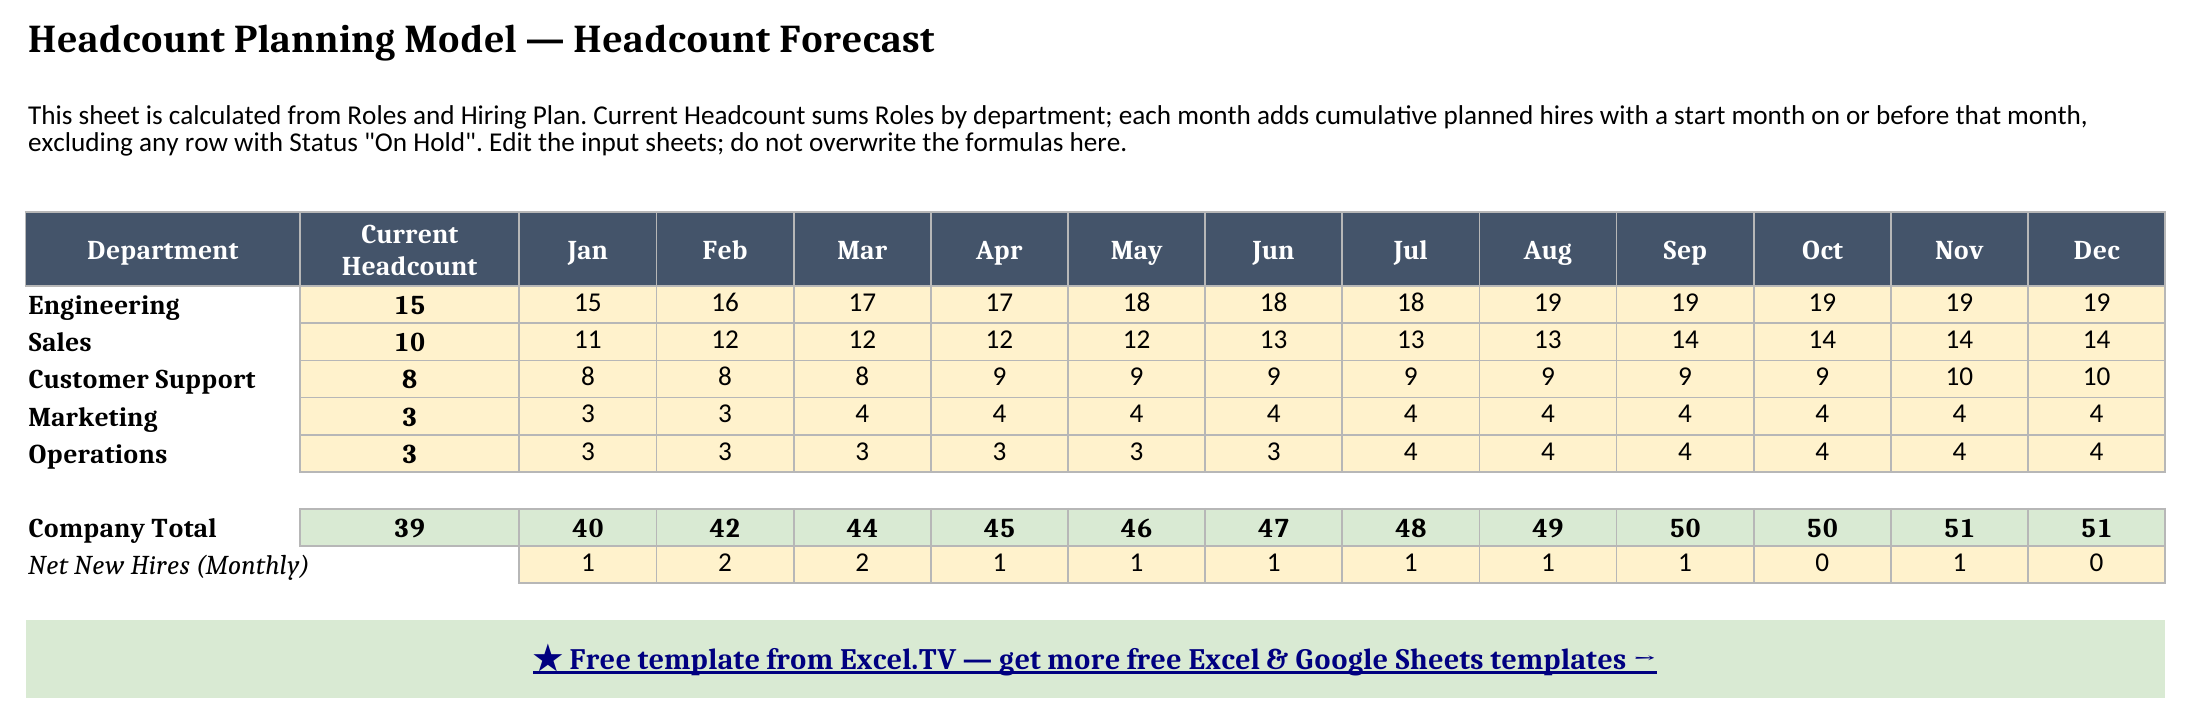
- Headcount Forecast — the output sheet: current headcount plus cumulative planned hires by department for each of the 12 months, a company total row, and a monthly net-new-hires row.
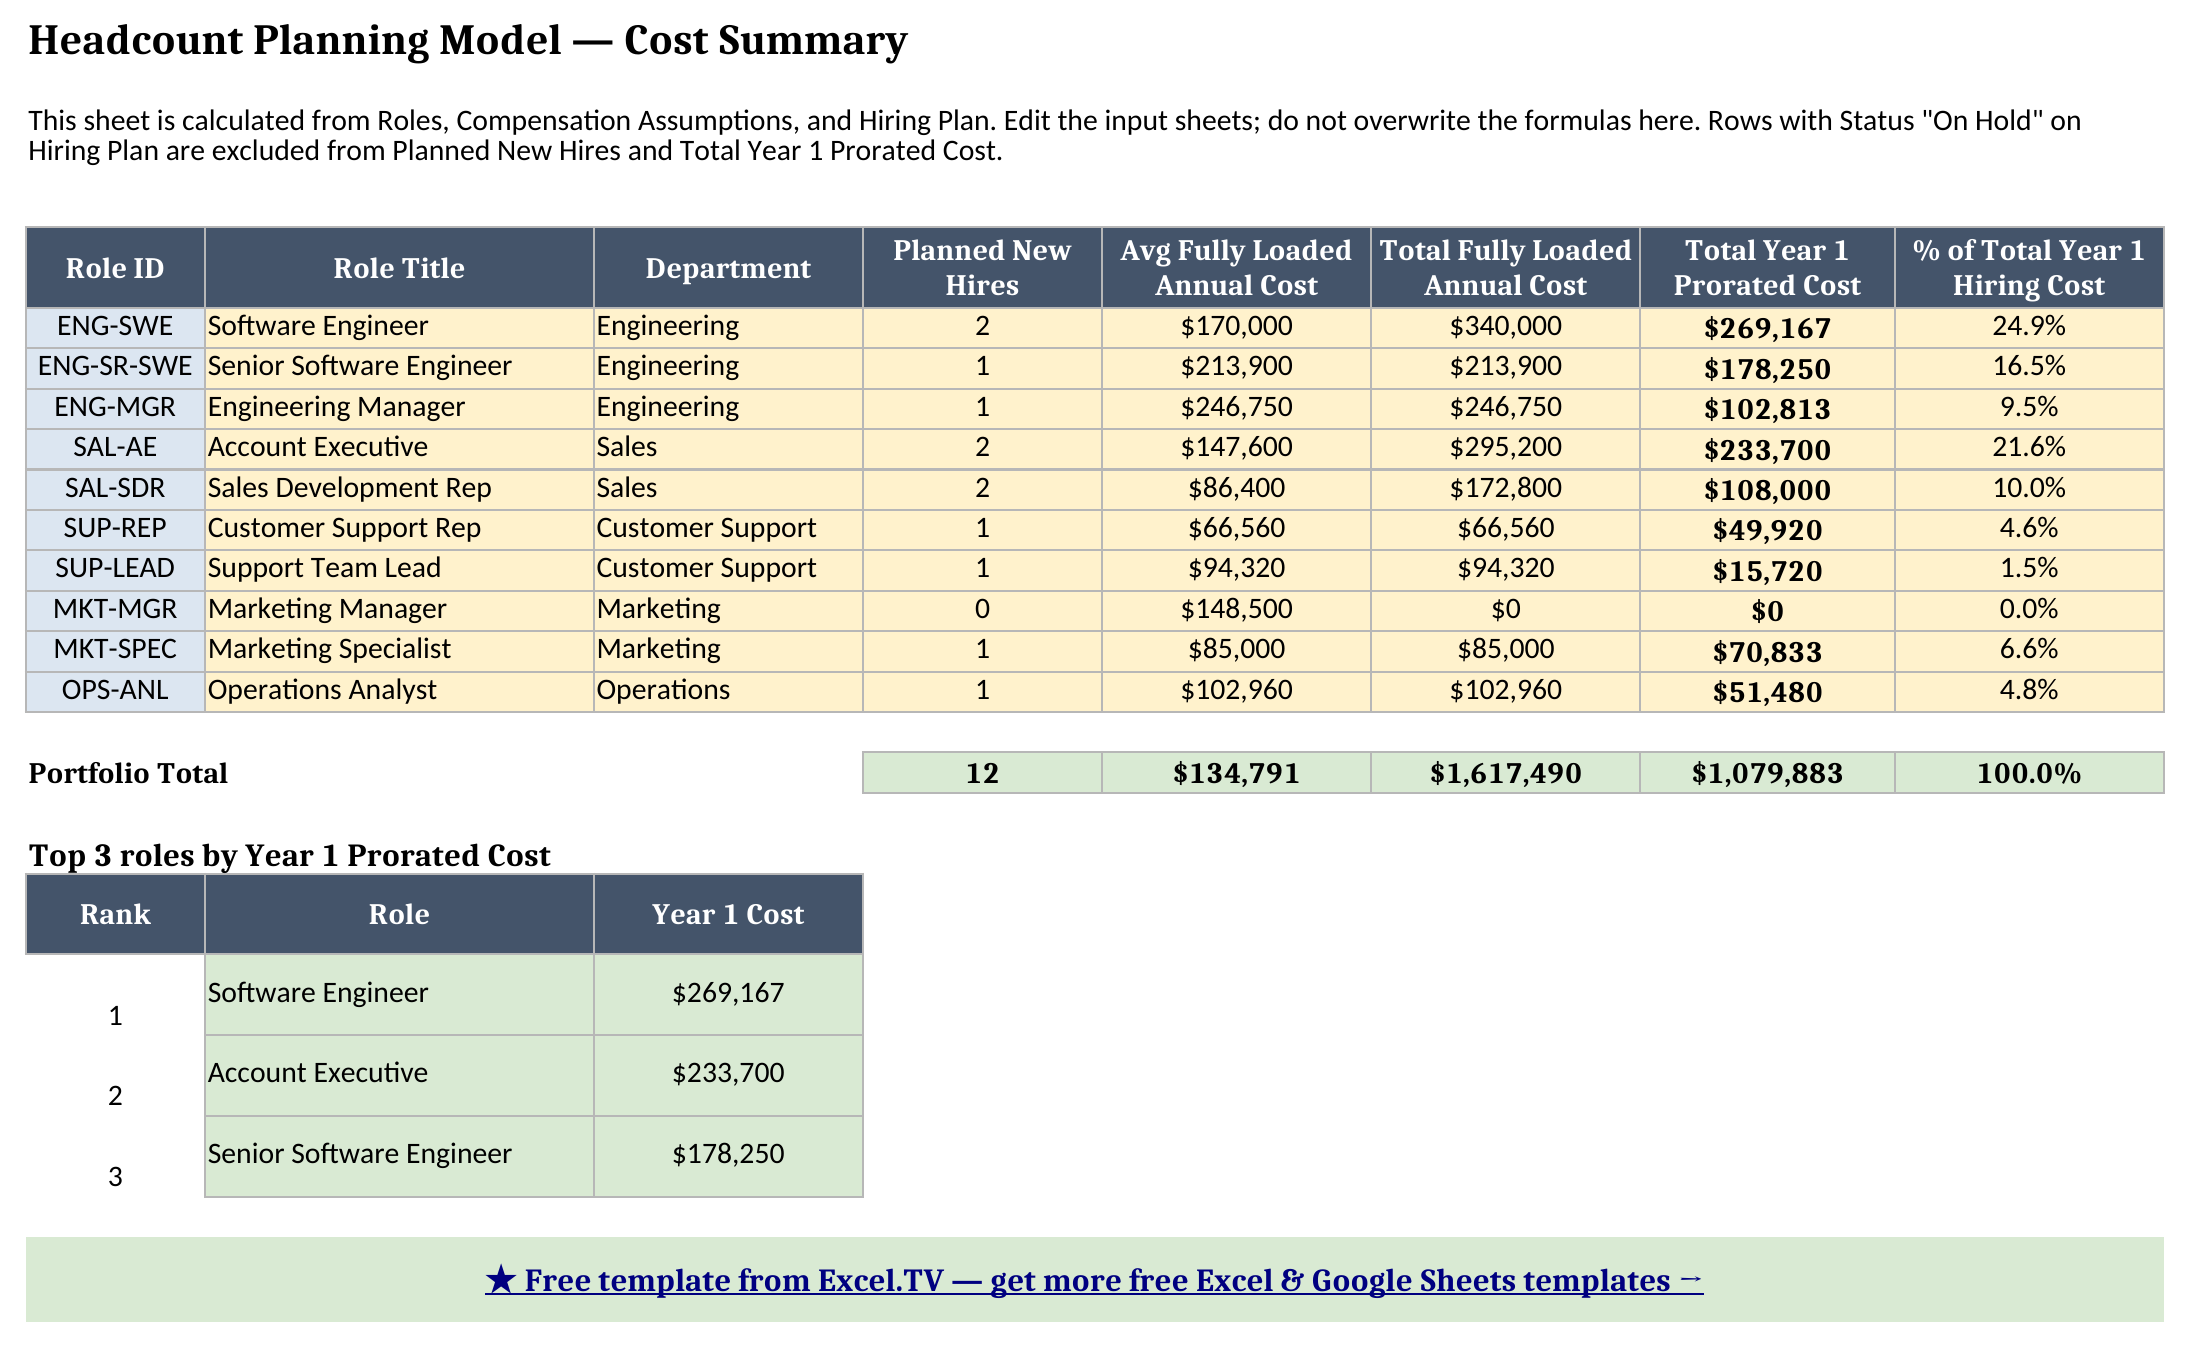
- Cost Summary — the output sheet: planned new hires, fully loaded cost, and Year 1 prorated cost by role, a portfolio total, and the top three roles by Year 1 hiring cost.
The required inputs are the role list with current headcount, compensation assumptions per role, and one row per planned hire with a start month and status. The main outputs are the Headcount Forecast’s month-by-month department and company totals, and the Cost Summary’s planned new hires, fully loaded cost, and Year 1 prorated cost.
How do I set up my own headcount planning model?
- Open Roles and replace the ten sample roles with your own. Keep each Role ID unique; every other sheet looks up or rolls up by this field.
- Open Compensation Assumptions and enter base salary, bonus %, benefits load %, employer tax %, and one-time recruiting cost for each Role ID.
- Open Hiring Plan and add one row per planned hire: choose a Role ID, a planned start month from 1 to 12, and a status.
- Open Headcount Forecast to review projected headcount by department for each month of the plan year.
- Open Cost Summary to review planned new hires, fully loaded cost, and Year 1 prorated cost by role, and which roles carry the largest hiring budget.
How the headcount forecast and staffing model actually work
Roles holds a Current Headcount figure per role — a starting point, not a rolling actuals feed. Headcount Forecast sums that figure by department to get each department’s Current Headcount column, then for each month adds a running COUNTIFS of Hiring Plan rows where the department matches, the Planned Start Month is on or before that month, and the Status is not “On Hold”. That last condition matters more than it looks: one of the sample hires, a second Customer Support Rep planned for October, is paused pending a ticket-volume review. Because its status is “On Hold”, it does not count toward Headcount Forecast or Cost Summary at all — it still exists as a row on Hiring Plan with its own cost calculated, but it is excluded from every roll-up until someone changes its status back.
The company total across all five departments starts at 39 and grows to 51 by December, with the running “Net New Hires (Monthly)” row showing exactly when each month’s growth lands — two new hires in February and March, none in October because the paused Customer Support Rep is excluded and nothing else was scheduled that month.
On the cost side, Compensation Assumptions calculates Fully Loaded Annual Cost as Base Salary * (1 + Bonus %) + Base Salary * (Benefits Load % + Employer Tax %). A Software Engineer at a $125,000 base with a 10% bonus target and a combined 26% benefits-and-tax load comes out to a $170,000 fully loaded annual cost. Hiring Plan then prorates that figure for the actual months a hire is active in the plan year: Months Active This Plan Year is 13 minus the planned start month, clamped between 0 and 12, and Year 1 Prorated Cost is the fully loaded cost times that fraction of the year. A Software Engineer starting in February is active for 11 months and carries $155,833 of Year 1 cost, while the same role starting in May is only active for 8 months and carries $113,333.
Worked example: ten roles, thirteen planned hires, one hiring budget
Here is the recalculated Cost Summary output from the sample workbook:
| Role | Planned New Hires | Avg Fully Loaded Annual Cost | Total Year 1 Prorated Cost | % of Total Year 1 Hiring Cost |
|---|---|---|---|---|
| Software Engineer | 2 | $170,000 | $269,167 | 24.9% |
| Account Executive | 2 | $147,600 | $233,700 | 21.6% |
| Senior Software Engineer | 1 | $213,900 | $178,250 | 16.5% |
| Sales Development Rep | 2 | $86,400 | $108,000 | 10.0% |
| Engineering Manager | 1 | $246,750 | $102,813 | 9.5% |
| Marketing Specialist | 1 | $85,000 | $70,833 | 6.6% |
| Operations Analyst | 1 | $102,960 | $51,480 | 4.8% |
| Customer Support Rep | 1 | $66,560 | $49,920 | 4.6% |
| Support Team Lead | 1 | $94,320 | $15,720 | 1.5% |
| Marketing Manager | 0 | $148,500 | $0 | 0.0% |
And the Portfolio Total row at the bottom of Cost Summary:
| Planned New Hires | Avg Fully Loaded Annual Cost | Total Fully Loaded Annual Cost | Total Year 1 Prorated Cost |
|---|---|---|---|
| 12 | $134,791 | $1,617,490 | $1,079,883 |
Twelve of the thirteen planned hires count toward the total (the paused Customer Support Rep is excluded), and the full-year fully loaded cost of $1,617,490 prorates down to $1,079,883 of actual Year 1 budget once each hire’s partial-year timing is applied. The top three roles by Year 1 cost are Software Engineer at $269,167, Account Executive at $233,700, and Senior Software Engineer at $178,250 — together just over 62% of the year’s total hiring cost, which is exactly the kind of concentration a hiring budget conversation needs to surface early rather than discover in Q4.
Notice that Engineering Manager has one of the highest fully loaded costs per hire ($246,750) but a comparatively low Year 1 Prorated Cost ($102,813), because that hire is not planned until August — only 5 of the 12 months. That is the difference between a full-year cost and a Year 1 budget number, and conflating the two is one of the more common headcount planning mistakes I see.
Grab the headcount planning model workbook if you want to change a start month, flip a status to “On Hold”, or add a role and watch the forecast and cost summary update.
How do I use this in Google Sheets?
Google Sheets works well for this staffing forecast google sheets use case because the workbook deliberately avoids Excel-only functions. Open Google Sheets, choose File > Import > Upload, select the downloaded .xlsx, and choose Insert new sheet(s). The formulas use only SUM, SUMIF, SUMIFS, COUNTIF, COUNTIFS, IF, IFERROR, INDEX, MATCH, MAX, MIN, ROUND, LARGE, and arithmetic, all of which are supported natively in Google Sheets.
The Role ID, Department, Level, Employment Type, and Status dropdown validations also import with the workbook. After import, start on Roles, then replace the sample Compensation Assumptions and Hiring Plan rows the same way you would in Excel — Headcount Forecast and Cost Summary recalculate automatically since they are plain worksheet formulas, not a connected data source.
Limitations to know before you rely on this
A few things are worth understanding before you bring this workbook into a planning meeting:
- This is a single 12-month plan year, not a multi-year model. Current Headcount on Roles is a fixed starting point, not a rolling actuals feed, and the workbook does not handle mid-year compensation changes or attrition.
- Planned Start Month is a whole month, not a date. A hire is treated as active for the entire remainder of that calendar month, so a hire on the 1st and a hire on the 28th of the same month are modeled identically.
- “On Hold” rows are fully excluded, not partially discounted. A paused hire contributes zero headcount and zero cost to every roll-up until its status changes back — there is no in-between “50% likely” state.
- The top-three ranking does not break ties. The
LARGEplusMATCHpattern on Cost Summary returns the first matching role if two roles have the exact same Year 1 Prorated Cost. - Fully loaded cost assumptions are simplified. Benefits load and employer tax are modeled as flat percentages of base salary rather than tiered or capped benefit costs, which is a reasonable planning approximation but not a payroll-accurate calculation.
- No macros or external connections. Everything is native worksheet logic, so the file stays portable between Excel and Google Sheets.
I would rather show you exactly where this staffing model simplifies reality than pretend a spreadsheet can replace a compensation team’s judgment. Used carefully, this workbook gives you a disciplined place to connect roles, pay assumptions, hiring timing, and cost so a headcount plan can survive the first round of questions about how the numbers were built.
Download the headcount planning model and replace the sample roles and hires when you are ready.
