
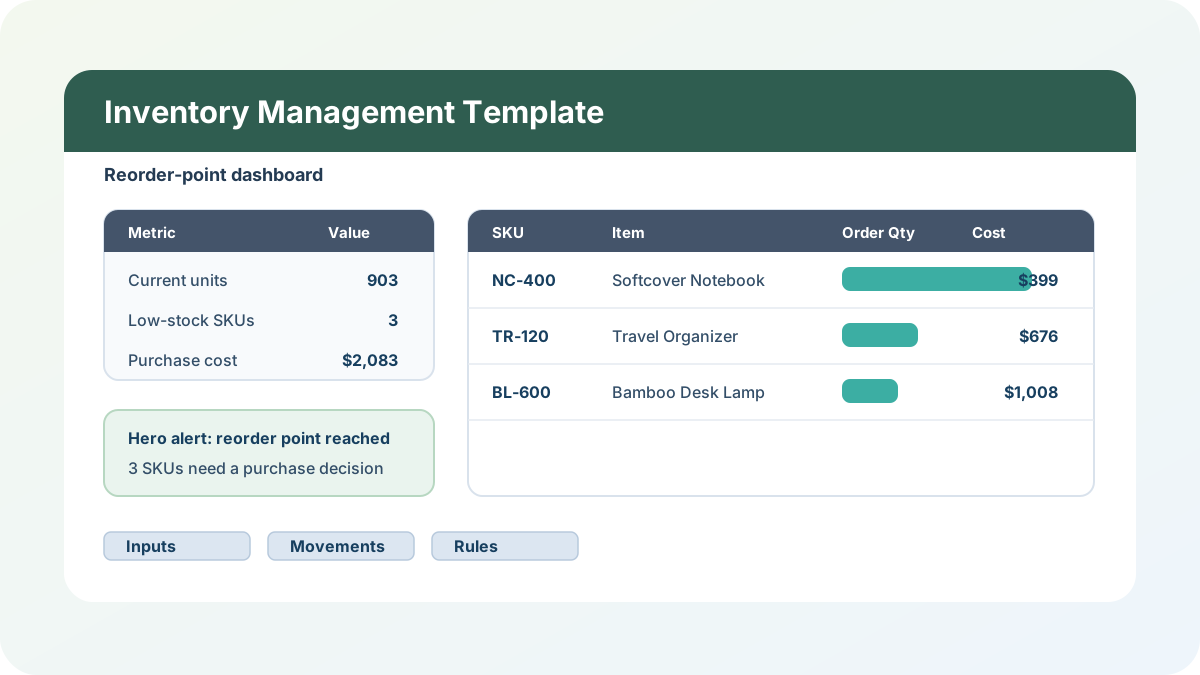
The inventory spreadsheets I get asked to rescue usually fail in the same quiet way: the stock count is a number someone typed last month, the incoming purchase orders are tracked somewhere else, and the reorder point is either a guess or a note in somebody’s head. By the time an item is visibly low, the team is already inside the supplier lead time. This inventory management excel template is built to stop that specific failure. It is not just a list of SKUs. It is a small connected model where item setup, stock movements, reorder rules, purchase planning, and dashboard outputs all reconcile back to the same SKU list.
Download the inventory management excel template — it is an ungated .xlsx file, no signup, no form, no macros, and no external data connections. Open it in Excel, replace the sample data, and the formulas will recalculate from your own receipts, issues, and reorder assumptions.
Who I built this for
I built this for a small operator who needs an honest inventory tracker excel template before they need a dedicated system: a retail shop, small ecommerce catalog, light manufacturing team, field stockroom, office manager, or nonprofit storing supplies across a few categories. If you have thousands of SKUs, barcode scans, serial numbers, bins, reservations, and purchase approvals, a spreadsheet will become too fragile. But if your immediate problem is, “Which items are low, how many should I order, and what will that cost?” this workbook is intentionally sized for that job.
The hero differentiator is the reorder-point alert. Current stock is not typed into the dashboard. It is calculated from opening stock plus every receipt and issue on the Stock Movements sheet. That current stock is compared to a reorder point built from lead time, daily demand, and safety stock. Once current stock is at or below the reorder point, Purchase Plan marks the SKU as Low Stock and calculates the order quantity needed to bring it back up to target stock.
What is in the workbook, sheet by sheet
The workbook ships with six sheets in this exact order:
- Instructions — setup steps, a colour legend, Google Sheets notes, limitations, and a clean-room disclosure. Every formula, layout decision, and sample record was authored from scratch for Excel.TV. No third-party template, workbook, brand asset, connector behavior, formula, or sample dataset was downloaded, inspected, mirrored, reproduced, or adapted.
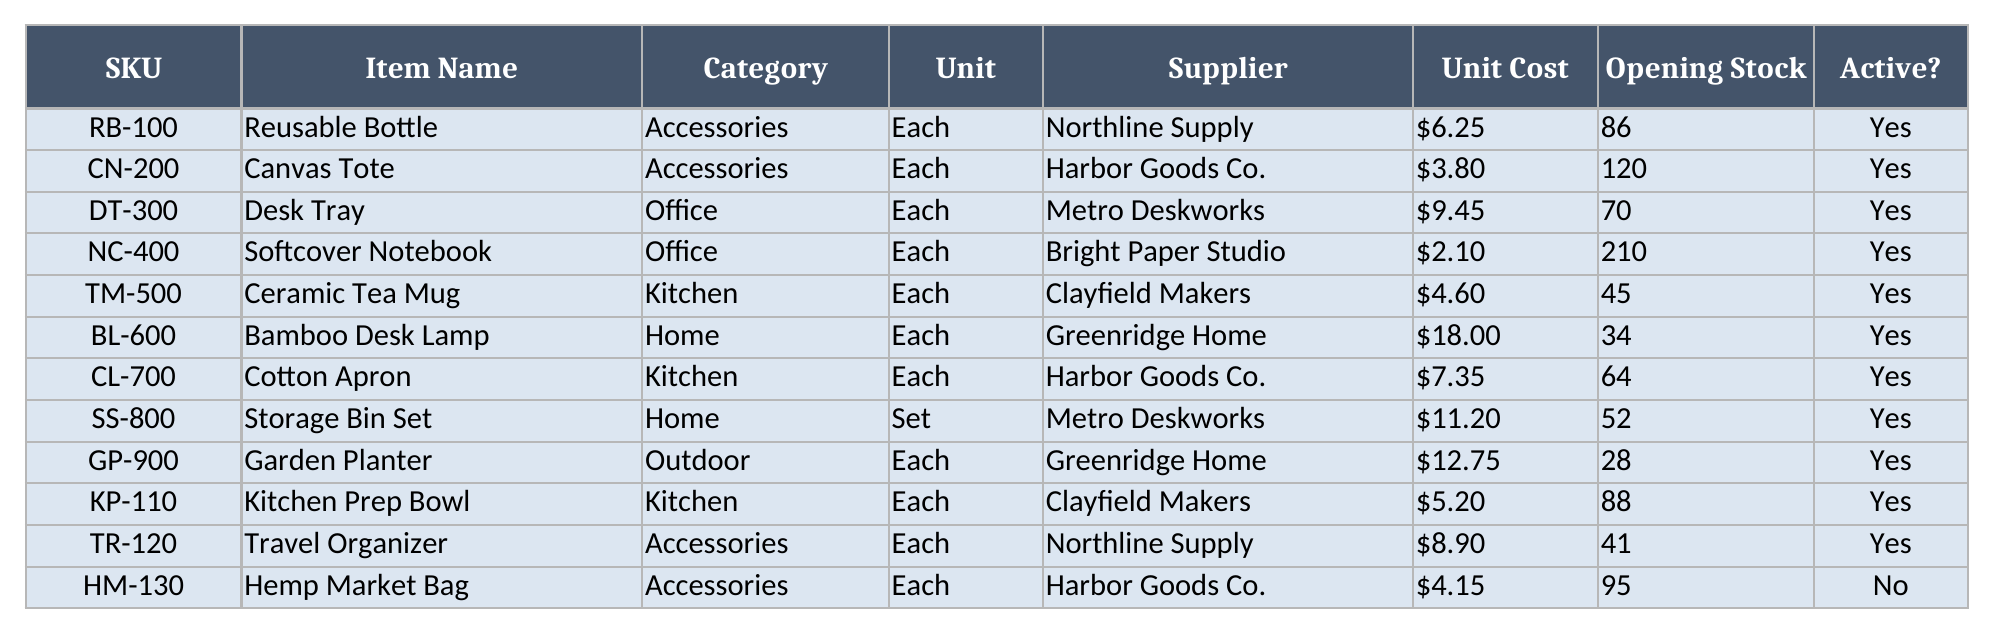
- Items — the SKU master list. This is where you enter SKU, item name, category, unit, supplier, unit cost, opening stock, and whether the item is active.
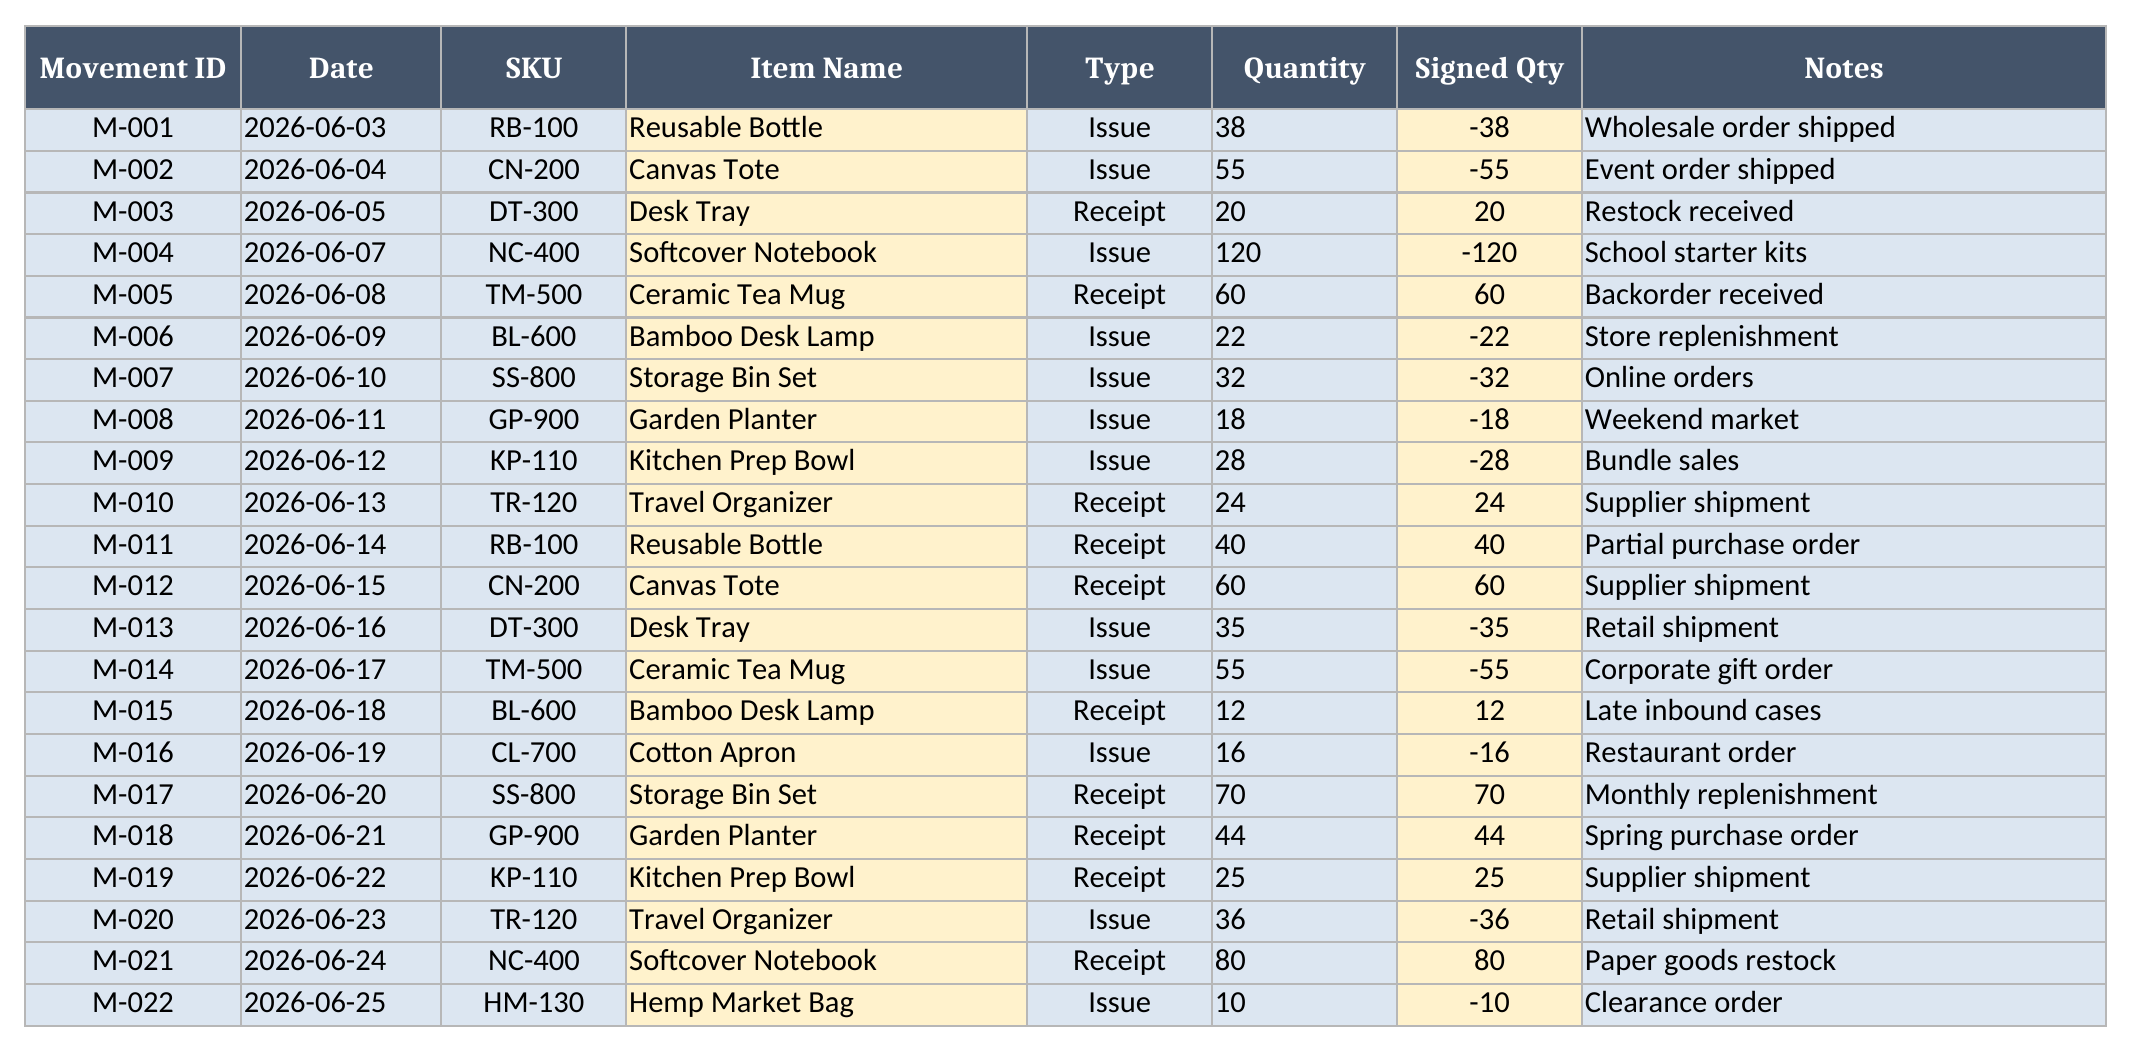
- Stock Movements — the transaction log. Each row is a receipt or issue. You enter movement ID, date, SKU, movement type, quantity, and notes; the item name and signed quantity calculate automatically.
- Reorder Rules — the planning assumptions by SKU: lead time days, safety stock, daily demand, and target stock. The reorder point formula calculates from those inputs.
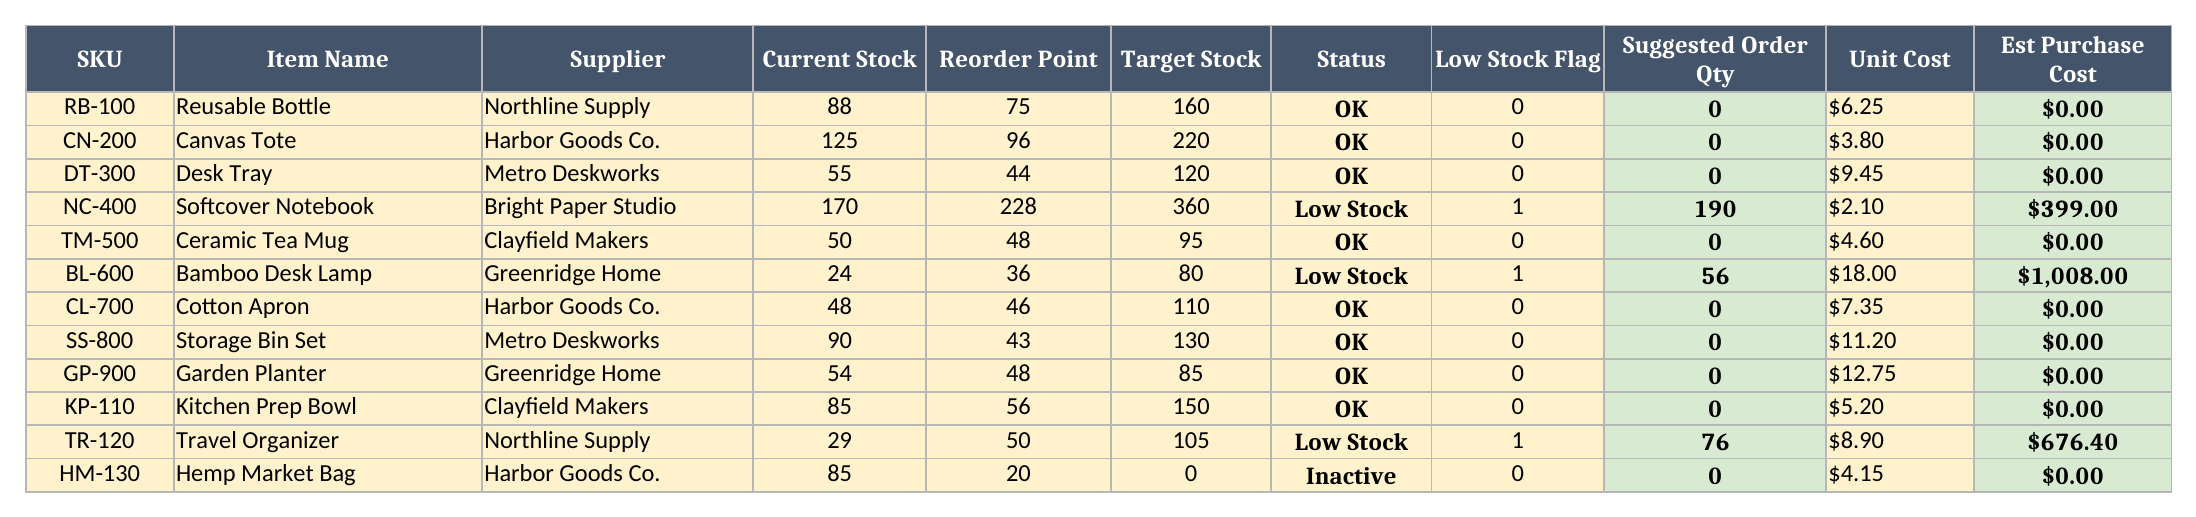
- Purchase Plan — the buying list. It calculates current stock, reorder point, target stock, status, low-stock flag, suggested order quantity, unit cost, and estimated purchase cost.
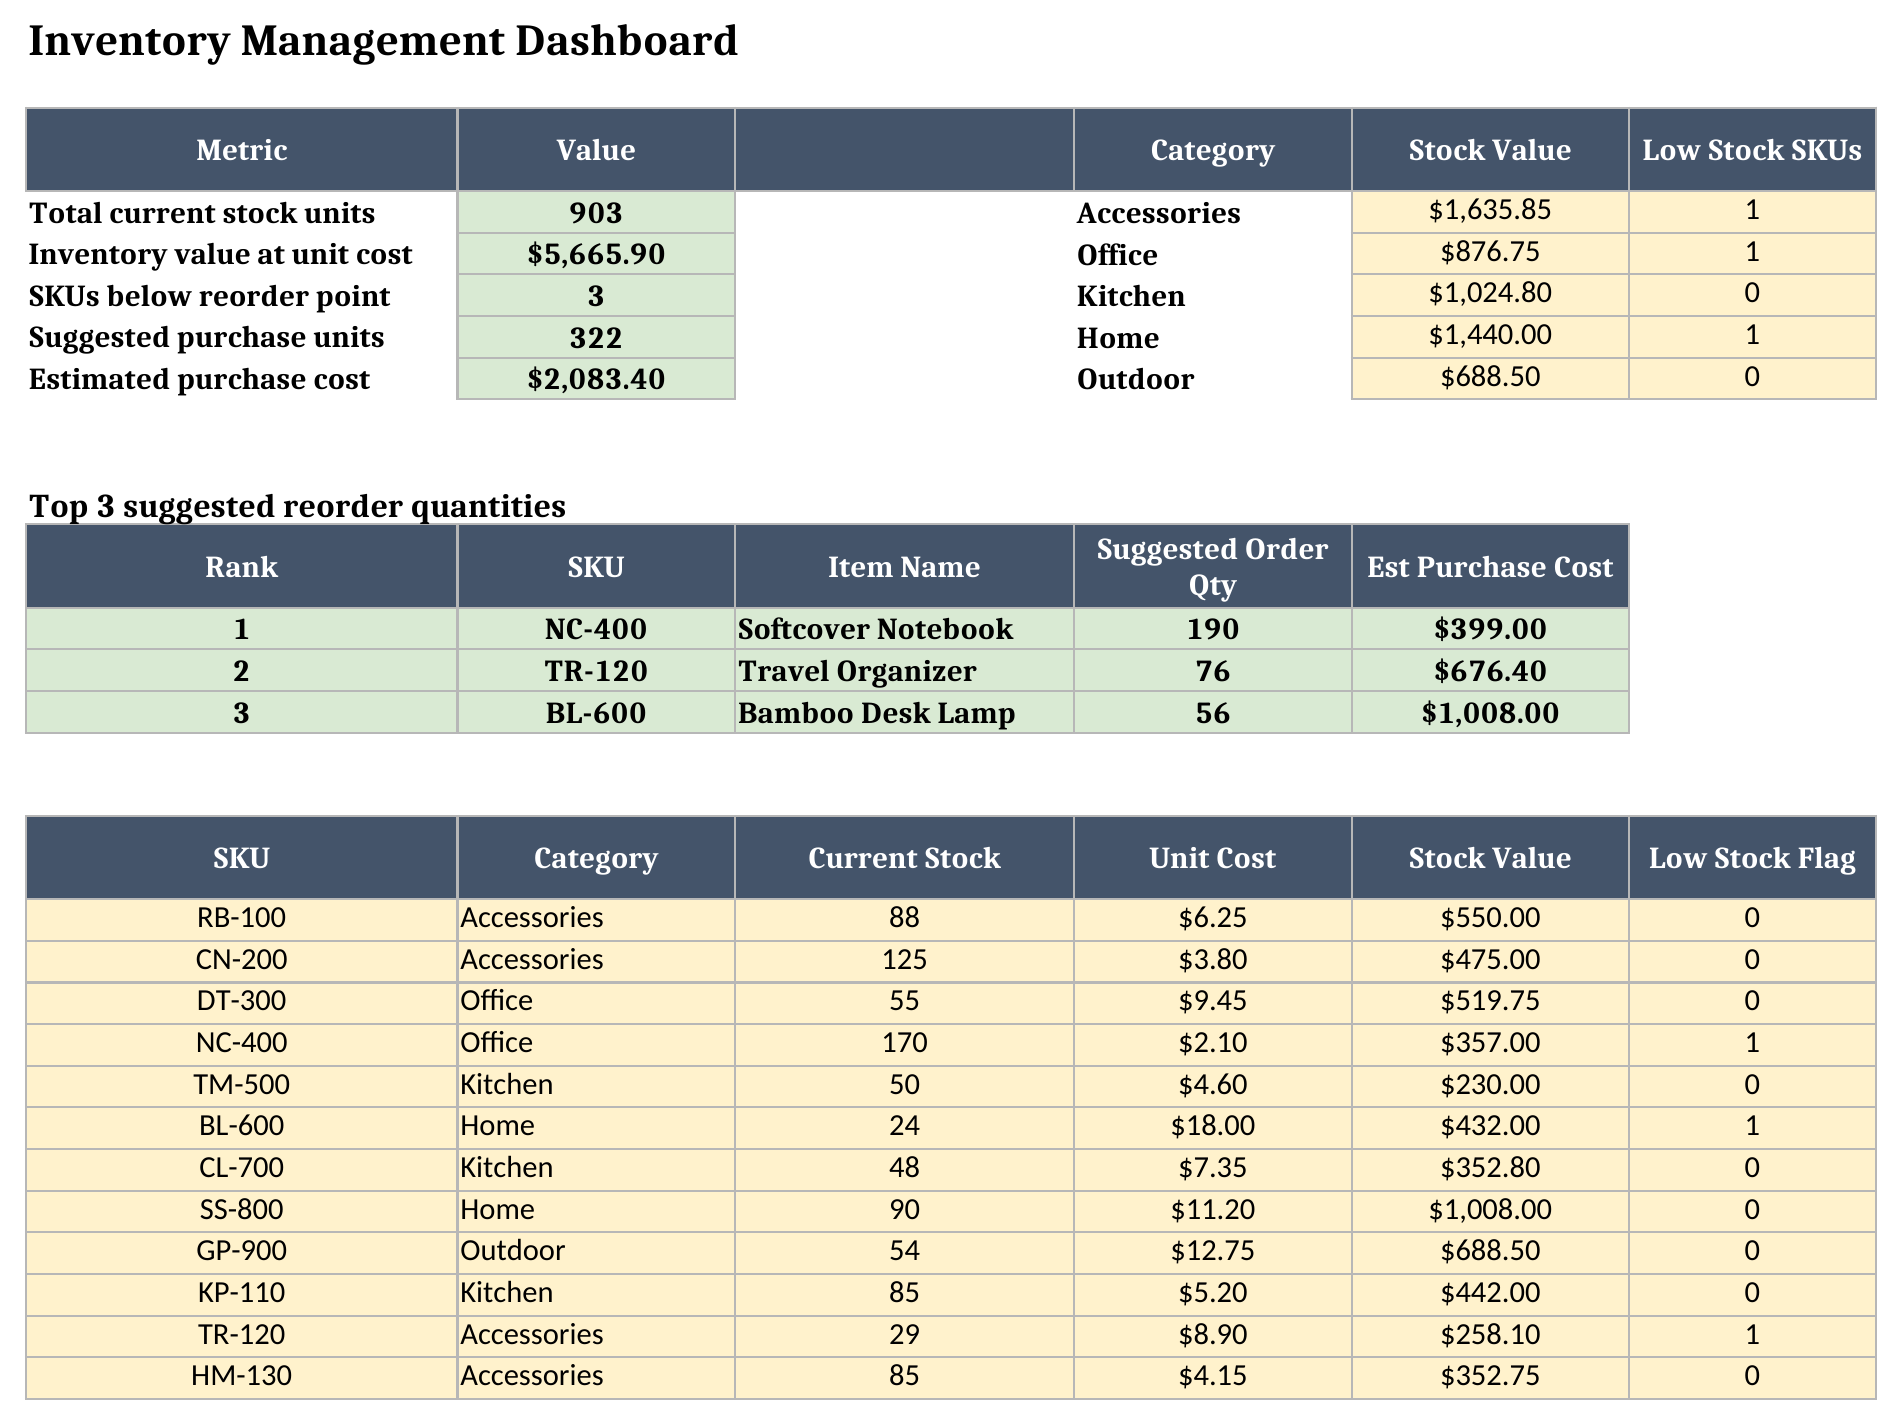
- Dashboard — the one-page summary: total units on hand, inventory value, number of low-stock SKUs, suggested purchase units, estimated purchase cost, category exposure, and the top three suggested reorder quantities.
The required inputs are deliberately separated from formulas. Blue cells are inputs, yellow cells are calculated, and green cells are outputs. That visual separation matters because inventory workbooks become unreliable when people overwrite formulas to “fix” a single row. If a current-stock number looks wrong, the fix should usually be a missing movement row, not a typed override on the report.
How I set up the inventory data model
The Items sheet is the anchor. Every downstream lookup keys off the SKU, so the first rule is simple: keep each SKU unique. The sample workbook includes twelve synthetic products across five categories, with made-up suppliers and made-up unit costs. The data is intentionally ordinary: bottles, totes, notebooks, lamps, bowls, planters, and similar stock items. That makes the workbook easy to inspect without relying on somebody else’s commercial dataset.
Opening Stock on Items is the starting count before the movement log begins. After that, Stock Movements takes over. A receipt row adds quantity; an issue row subtracts quantity. The Signed Qty formula on Stock Movements is intentionally plain:
=IF(Type="Issue",Quantity*-1,Quantity)In the actual workbook that formula is written row by row, for example =IF(E2="Issue",F2*-1,F2). Purchase Plan then calculates current stock as opening stock plus the SUMIF of signed movements for that SKU. That gives you a compact stock ledger without using macros, scripts, external links, or database connections.
How the reorder-point alert works
Reorder Rules is where the workbook becomes more than a stock list. For each SKU, you enter four planning assumptions:
- Lead Time Days — how long replenishment usually takes.
- Safety Stock — the extra units you want on hand to absorb uncertainty.
- Daily Demand — the average units used or sold per day.
- Target Stock — the level you want to refill to when an order is needed.
The reorder point is calculated as:
=ROUND((Lead Time Days*Daily Demand)+Safety Stock,0)That means an item with 14 lead-time days, 12 units of daily demand, and 60 units of safety stock has a reorder point of 228 units. In the sample workbook, Softcover Notebook uses exactly those assumptions. Its current stock after movements is 170 units, so Purchase Plan marks it Low Stock and suggests ordering 190 units to reach its 360-unit target stock.
I chose the current stock <= reorder point trigger instead of current stock < reorder point because I would rather see the alert the moment the threshold is reached. If your process only orders once the stock count falls below the threshold, you can change that comparison in the Status and Low Stock Flag formulas, but I would make that choice deliberately.
Worked example from the recalculated workbook
I forced a full LibreOffice recalculation before writing this section so the numbers below match the workbook, not a hand summary. The Dashboard currently shows:
| Metric | Recalculated value |
|---|---|
| Total current stock units | 903 |
| Inventory value at unit cost | $5,665.90 |
| SKUs below reorder point | 3 |
| Suggested purchase units | 322 |
| Estimated purchase cost | $2,083.40 |
The three low-stock SKUs are:
| SKU | Item | Current Stock | Reorder Point | Suggested Order Qty | Estimated Purchase Cost |
|---|---|---|---|---|---|
| NC-400 | Softcover Notebook | 170 | 228 | 190 | $399.00 |
| TR-120 | Travel Organizer | 29 | 50 | 76 | $676.40 |
| BL-600 | Bamboo Desk Lamp | 24 | 36 | 56 | $1,008.00 |
Those rows show why I like separating reorder point from target stock. The alert answers, “Do I need to act?” Target stock answers, “How much should I buy if I act?” Softcover Notebook is 58 units below its reorder point, but the suggested order quantity is 190 because the plan refills it back to 360 units, not merely back to 228. Bamboo Desk Lamp is a smaller quantity, but it carries the largest purchase cost because its unit cost is $18.00.
The category rollup on Dashboard is there because purchase decisions are rarely SKU-only. In the sample data, Accessories has $1,635.85 of stock value and one low-stock SKU, Office has $876.75 of stock value and one low-stock SKU, Home has $1,440.00 of stock value and one low-stock SKU, Kitchen has no low-stock SKUs, and Outdoor has no low-stock SKUs. That is enough context to tell whether a purchase run is concentrated in one category or spread across the catalog.
How to replace the sample data
Start on Items. Replace the sample SKU list with your own SKUs, names, categories, suppliers, unit costs, opening stock, and active flags. If an item is discontinued, set Active? to No instead of deleting it immediately; Purchase Plan will show it as Inactive, which is safer when old movement rows still reference that SKU.
Next, update Stock Movements. Use one row per receipt or issue. Do not enter negative issue quantities; choose Type = Issue and enter the quantity as a positive number. The Signed Qty formula handles the subtraction. That convention makes validation easier and prevents half the team from entering issues as negatives while the other half uses a type column.
Then edit Reorder Rules. Lead time, safety stock, daily demand, and target stock are assumptions, not facts. I would rather see you start with conservative numbers and revise them monthly than pretend the first version is perfect. If target stock is below reorder point, the workbook will still calculate, but the business logic is probably wrong: you would be asking the model to order back to a level that is already too low.
Finally, review Purchase Plan and Dashboard. Purchase Plan is the action sheet. Dashboard is the inspection sheet. If you see a surprising alert, trace it in this order: current stock, movement rows, opening stock, reorder rule inputs. That path catches most spreadsheet inventory errors faster than scanning formulas randomly.
Grab the stock management template excel workbook and replace the sample catalog when you are ready.
Using it as a Google Sheets inventory management template
This workbook is built to convert cleanly into Google Sheets. Open Google Sheets, choose File > Import > Upload, select the downloaded .xlsx, and import it as a new spreadsheet. The formula set is intentionally limited to SUM, SUMIF, SUMIFS, IF, IFERROR, INDEX, MATCH, ROUND, LARGE, and arithmetic/comparison operators, so there are no Excel-only functions to rewrite. The SKU, category, active-status, and movement-type dropdown validations are also standard validations that should carry over during conversion.
If you prefer to start directly in the browser, use the published Google Sheets inventory management template. That link opens Google’s copy flow, so you get your own editable version instead of working in the shared source file.
Limitations to know before you rely on this
A few limits are worth calling out before you put real operations into the file:
- Completeness of movements matters. Current stock is only as good as the receipts and issues you enter. If a shipment leaves the building and never hits Stock Movements, the dashboard will overstate stock.
- No lot, bin, or serial tracking. This template tracks SKU-level quantities, not lot numbers, expiration dates, warehouse bins, or serialized units.
- No demand forecasting. Daily demand is an input you maintain. The workbook does not calculate demand from past sales or seasonality.
- Top-three ties use the first match. The
LARGEplusMATCHpattern returns the first item with the matching suggested order quantity if two items tie exactly. - Range expansion is manual. If you add more SKUs or many more movement rows, expand the formulas and validations deliberately so the new rows are included.
- No macros or external data connections. That is deliberate. The file stays portable between Excel and Google Sheets because everything is native worksheet logic.
I would rather make those constraints explicit than pretend a spreadsheet is a warehouse system. For the right use case, though, this is the structure I want: one SKU list, one movement log, one reorder rule table, one purchase plan, and one dashboard that tells you what needs attention before the shelf is empty.
