
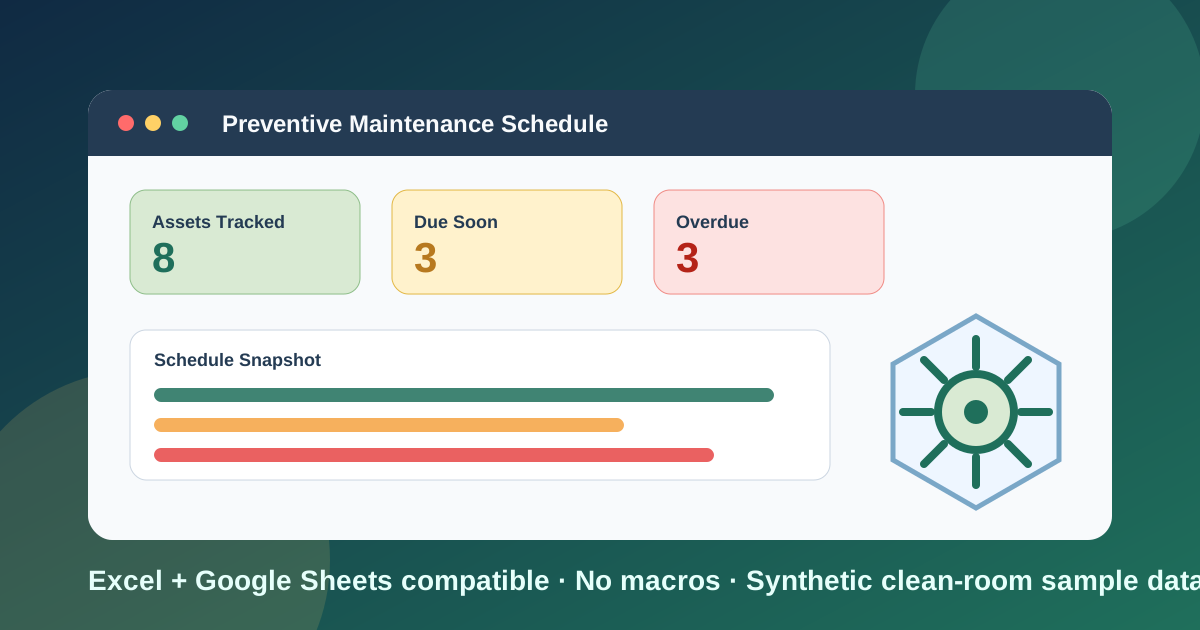
I built this preventive maintenance schedule template for the spreadsheet version of a problem I see all the time: the asset list is in one file, the completed work orders are in another file, and the maintenance meeting turns into a scavenger hunt. Someone asks which equipment is overdue, someone else asks whether downtime is mostly planned or unplanned, and the answer depends on who last updated the tracker.
Download the preventive maintenance schedule template - it is a plain .xlsx, no macros, no external data connections, no sign-up, and no hidden SaaS requirement. Open it in Excel or import it into Google Sheets, replace the synthetic sample data with your own equipment, and the schedule, downtime summary, and dashboard recalculate from there.
This is not meant to replace a full computerized maintenance management system. It is meant to be the best version of the spreadsheet that many small teams actually need first: a clean equipment register, a maintenance log, a due-date schedule, and a dashboard that tells you what needs attention before a missed PM becomes downtime.
Video walkthrough
The current format requirement for this template includes a video walkthrough. I do not have external publishing credentials in this repository workflow, so I created the complete local video artifact and embedded only the reviewable local path below. The file is part of this deliverable at /images/preventive-maintenance-schedule-template/walkthrough.mp4, with captions at /images/preventive-maintenance-schedule-template/walkthrough.vtt.
Who I built this for
I built this for a maintenance lead, operations manager, plant administrator, facilities coordinator, or small business owner who needs an equipment maintenance log template excel users can understand without training. If your current process is a whiteboard plus a shared folder of invoices, this workbook gives you a more controlled place to start. If you already have a CMMS, this can still work as a simple reporting export or teaching example, but it is not trying to duplicate work-order dispatch, mobile inspections, parts inventory, photo storage, or compliance signatures.
The workbook assumes you want to answer five practical questions:
- What assets are we tracking?
- When was the last preventive maintenance done?
- What is due next, overdue now, or due soon?
- How much downtime and cost has each asset produced?
- Which assets should I talk about first in the weekly maintenance review?
That is why the file is built around an asset register, a maintenance log, a schedule, and a dashboard instead of one giant table. One sheet can do everything for a while, but once equipment counts grow, a single table becomes hard to audit. I would rather separate inputs from calculations and make the workbook boring in the best possible way.
What’s in the workbook, sheet by sheet
The workbook ships with six sheets, in this exact order:
- Instructions - a concise setup guide, color legend, clean-room disclosure, Google Sheets note, and limitations.
- Asset Register - the master list of equipment. Each row has an Asset ID, asset name, equipment type, location, criticality, PM frequency in days, last PM date, target downtime hours, replacement cost, and notes.
- Maintenance Log - completed work orders. Each row captures the work order ID, asset ID, service date, service type, planned vs. unplanned flag, technician, downtime hours, labor cost, parts cost, condition rating, and notes.
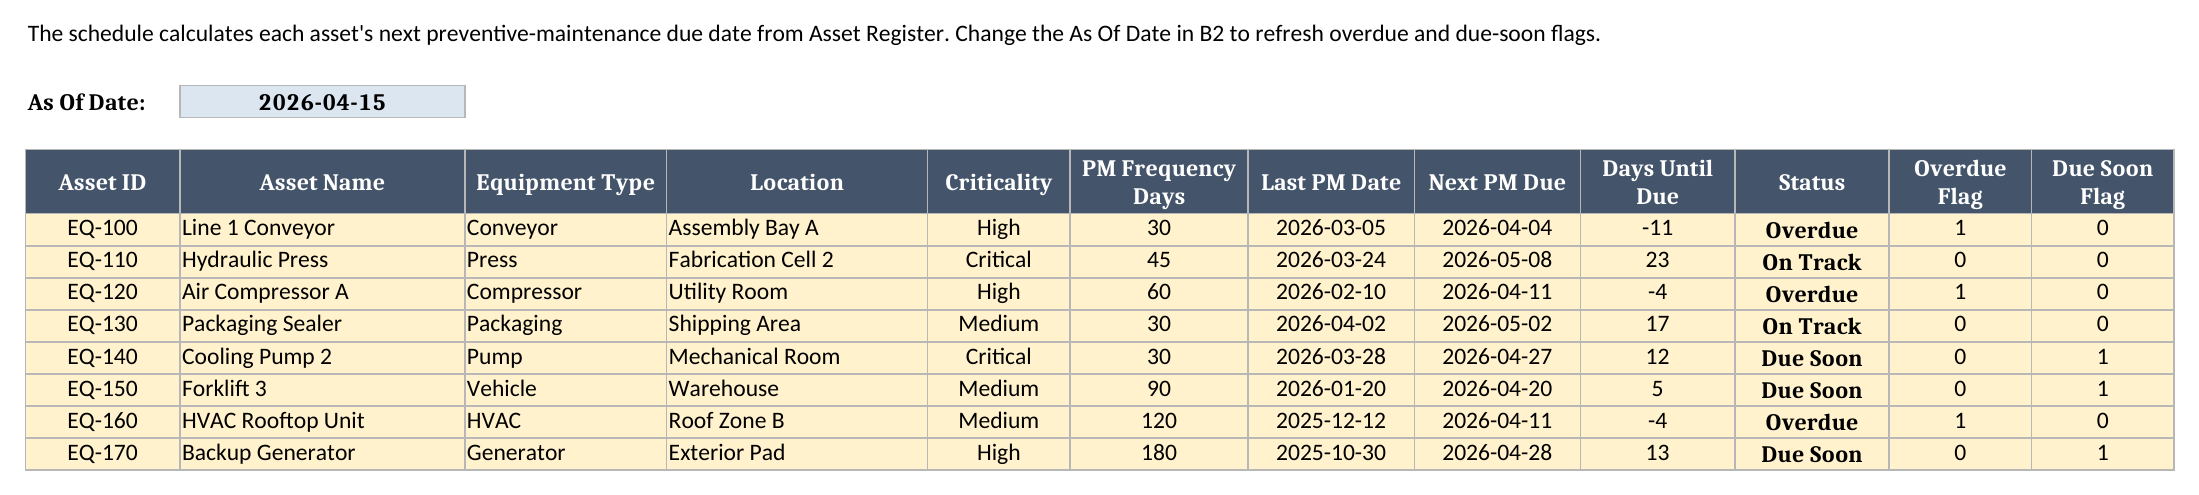
- Schedule - the calculated preventive-maintenance schedule. It pulls every asset from Asset Register, calculates the next due date, compares it with the as-of date, and flags each asset as Overdue, Due Soon, or On Track.
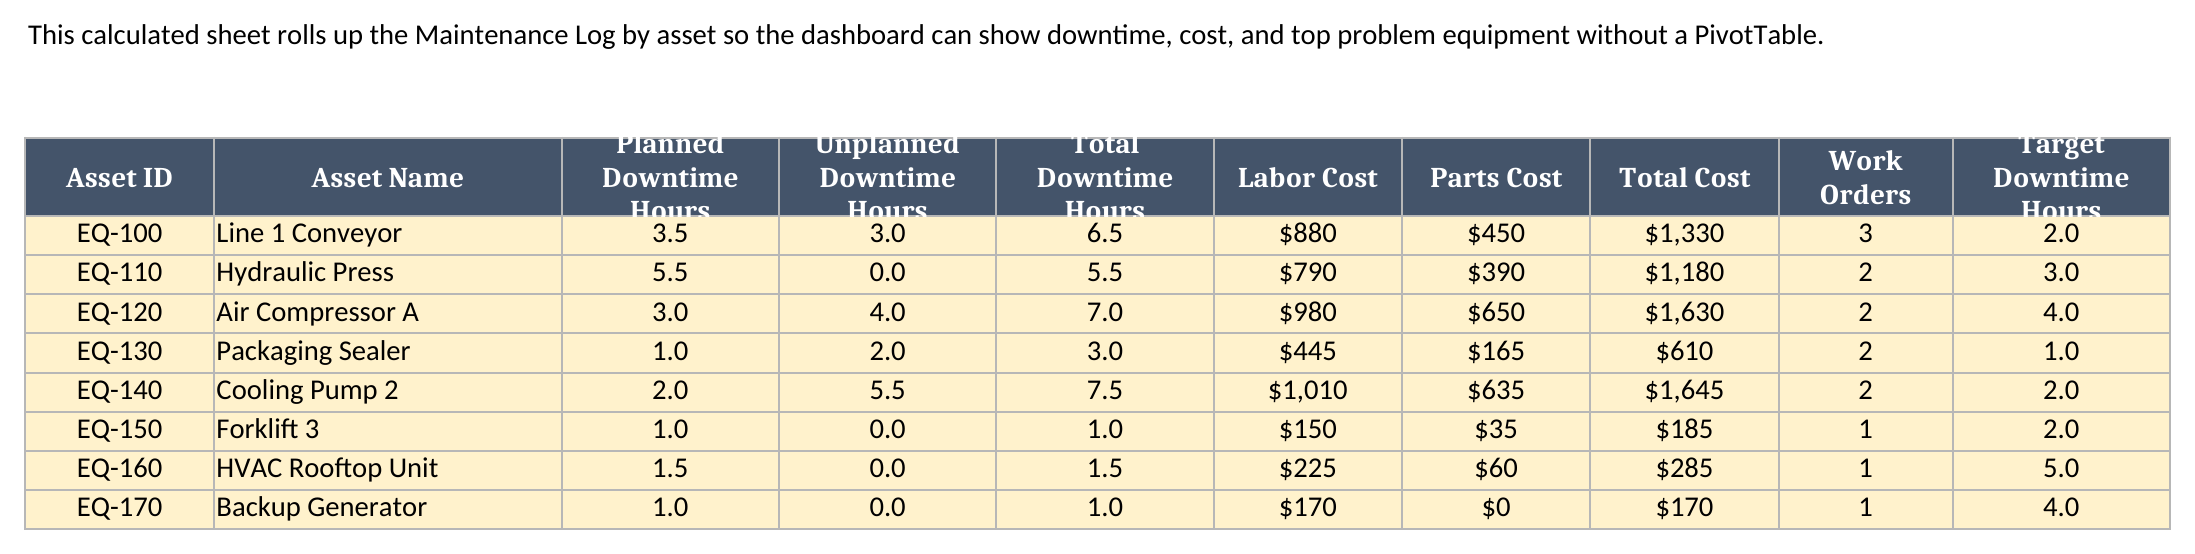
- Downtime Summary - the calculated rollup by asset. It uses the Maintenance Log to summarize planned downtime, unplanned downtime, total downtime, labor cost, parts cost, total cost, and work-order count.
- Dashboard - the one-page output: assets tracked, overdue assets, due-soon assets, downtime hours, unplanned downtime, maintenance cost, top downtime assets, and the overdue assets to review.
The required inputs are the asset rows on Asset Register and the work-order rows on Maintenance Log. The main outputs are Schedule, Downtime Summary, and Dashboard. I made the calculated sheets yellow or green so it is obvious where formulas live and where user-entered data belongs.
How I set up the Asset Register
Asset Register is the key sheet because every lookup depends on the Asset ID. I used sample IDs like EQ-100, EQ-110, and EQ-120 because they are easy to scan and easy to replace. Your real IDs can be serial numbers, internal asset tags, vehicle numbers, machine numbers, or building system IDs. The important rule is that each Asset ID appears once and only once.
The fields I care about most are PM Frequency Days and Last PM Date. I used days instead of text labels like “monthly” or “quarterly” because a number is easier to calculate in both Excel and Google Sheets. If an asset is serviced every 30 days, PM Frequency Days is 30. If it is serviced twice a year, use 180. The Schedule sheet can then calculate the next PM due date with simple arithmetic instead of a fragile date-text conversion.
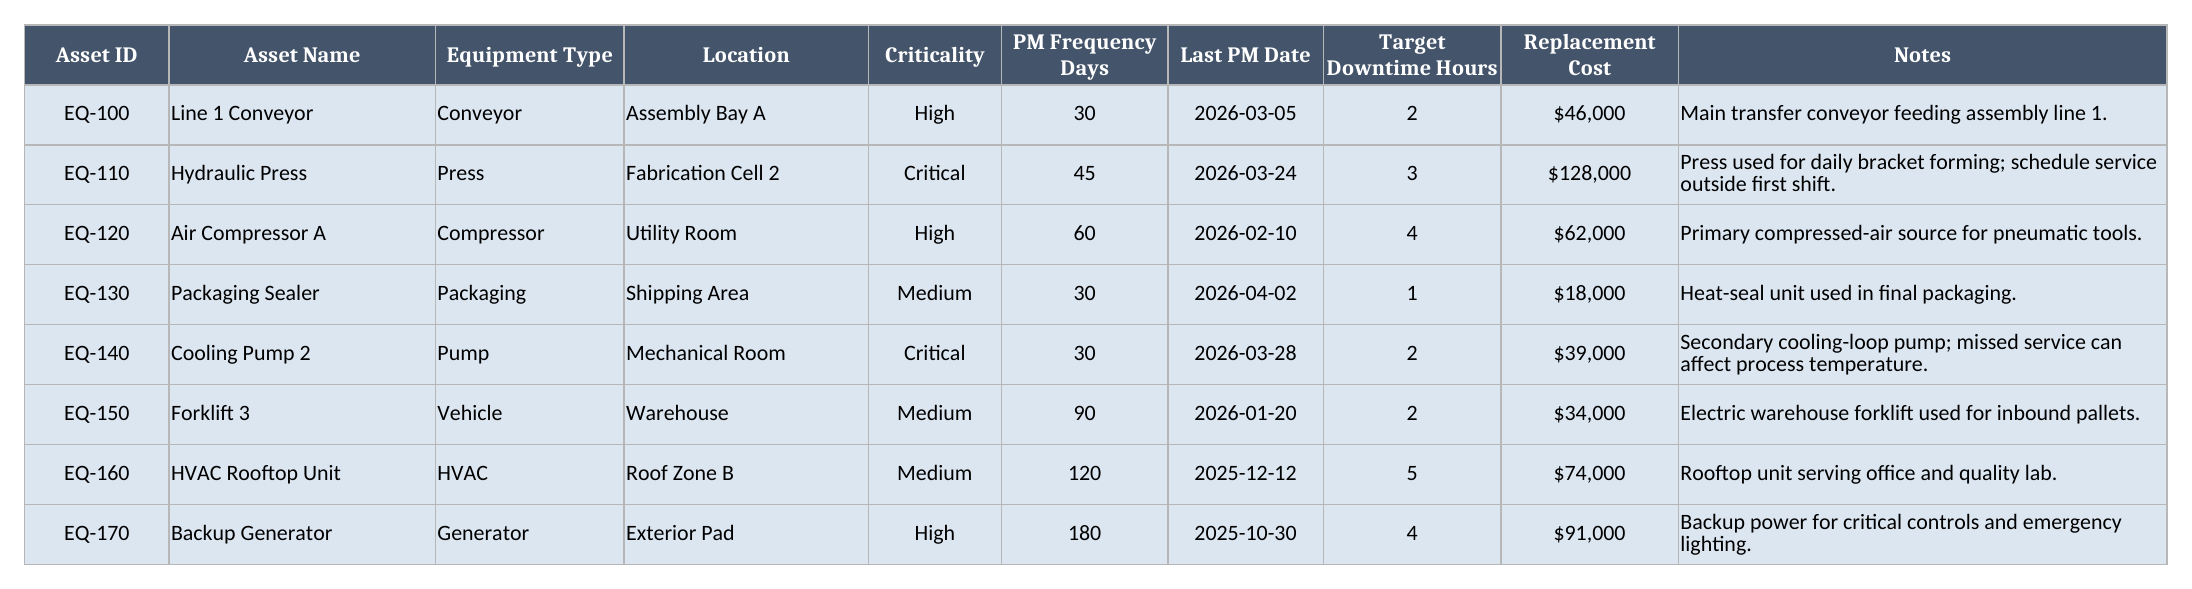
I also included criticality because not every overdue asset deserves the same response. A low-risk office unit being four days late is not the same operational issue as a production compressor being four days late. The workbook does not force a priority score, but the criticality column gives you a clean place to sort, filter, or add your own escalation rule.
How the maintenance log feeds the summary
Maintenance Log is where completed work orders go. I included a service type dropdown, a planned Yes/No dropdown, downtime hours, labor cost, parts cost, and condition rating. The Asset Name column is calculated with INDEX/MATCH, so if someone enters an Asset ID that does not exist in Asset Register, the row shows (unknown asset) instead of silently creating a bad summary.
The planned flag matters. Preventive maintenance is supposed to create some planned downtime, but the better question is whether unplanned downtime is growing. In the sample data, Line 1 Conveyor has both planned PM and an unplanned repair after a jam. Air Compressor A has a preventive PM row and a later repair row. Cooling Pump 2 has an unplanned repair and then a preventive PM. Those sample rows are synthetic, but they are realistic enough to show the workbook’s behavior.
Downtime Summary does not use a PivotTable because I wanted the file to import cleanly into Google Sheets and remain transparent. Each asset row uses SUMIFS to total planned downtime where Planned? equals Yes, unplanned downtime where Planned? equals No, and costs from the matching Asset ID. Work-order count is handled by a calculated helper column in Maintenance Log and a SUMIF on that helper. It is less glamorous than a PivotTable, but it is easier to inspect and easier to keep compatible.
How the schedule flags overdue and due-soon work
Schedule is the sheet I expect people to live in during a weekly review. The as-of date is set to April 15, 2026 in the sample file. For each asset, the workbook calculates:
Next PM Due = Last PM Date + PM Frequency Days
Then it compares that next due date with the as-of date. If the due date is before the as-of date, the status is Overdue. If it is due within the next 14 days and is not already overdue, the status is Due Soon. Everything else is On Track.
I used helper flag columns for Overdue Flag and Due Soon Flag because it keeps the dashboard simple. The dashboard can sum the flags instead of using a more complicated count formula. That also makes the workbook easier to audit: if the dashboard says three assets are overdue, you can look down the Overdue Flag column and see the three 1 values.
Worked example from the sample workbook
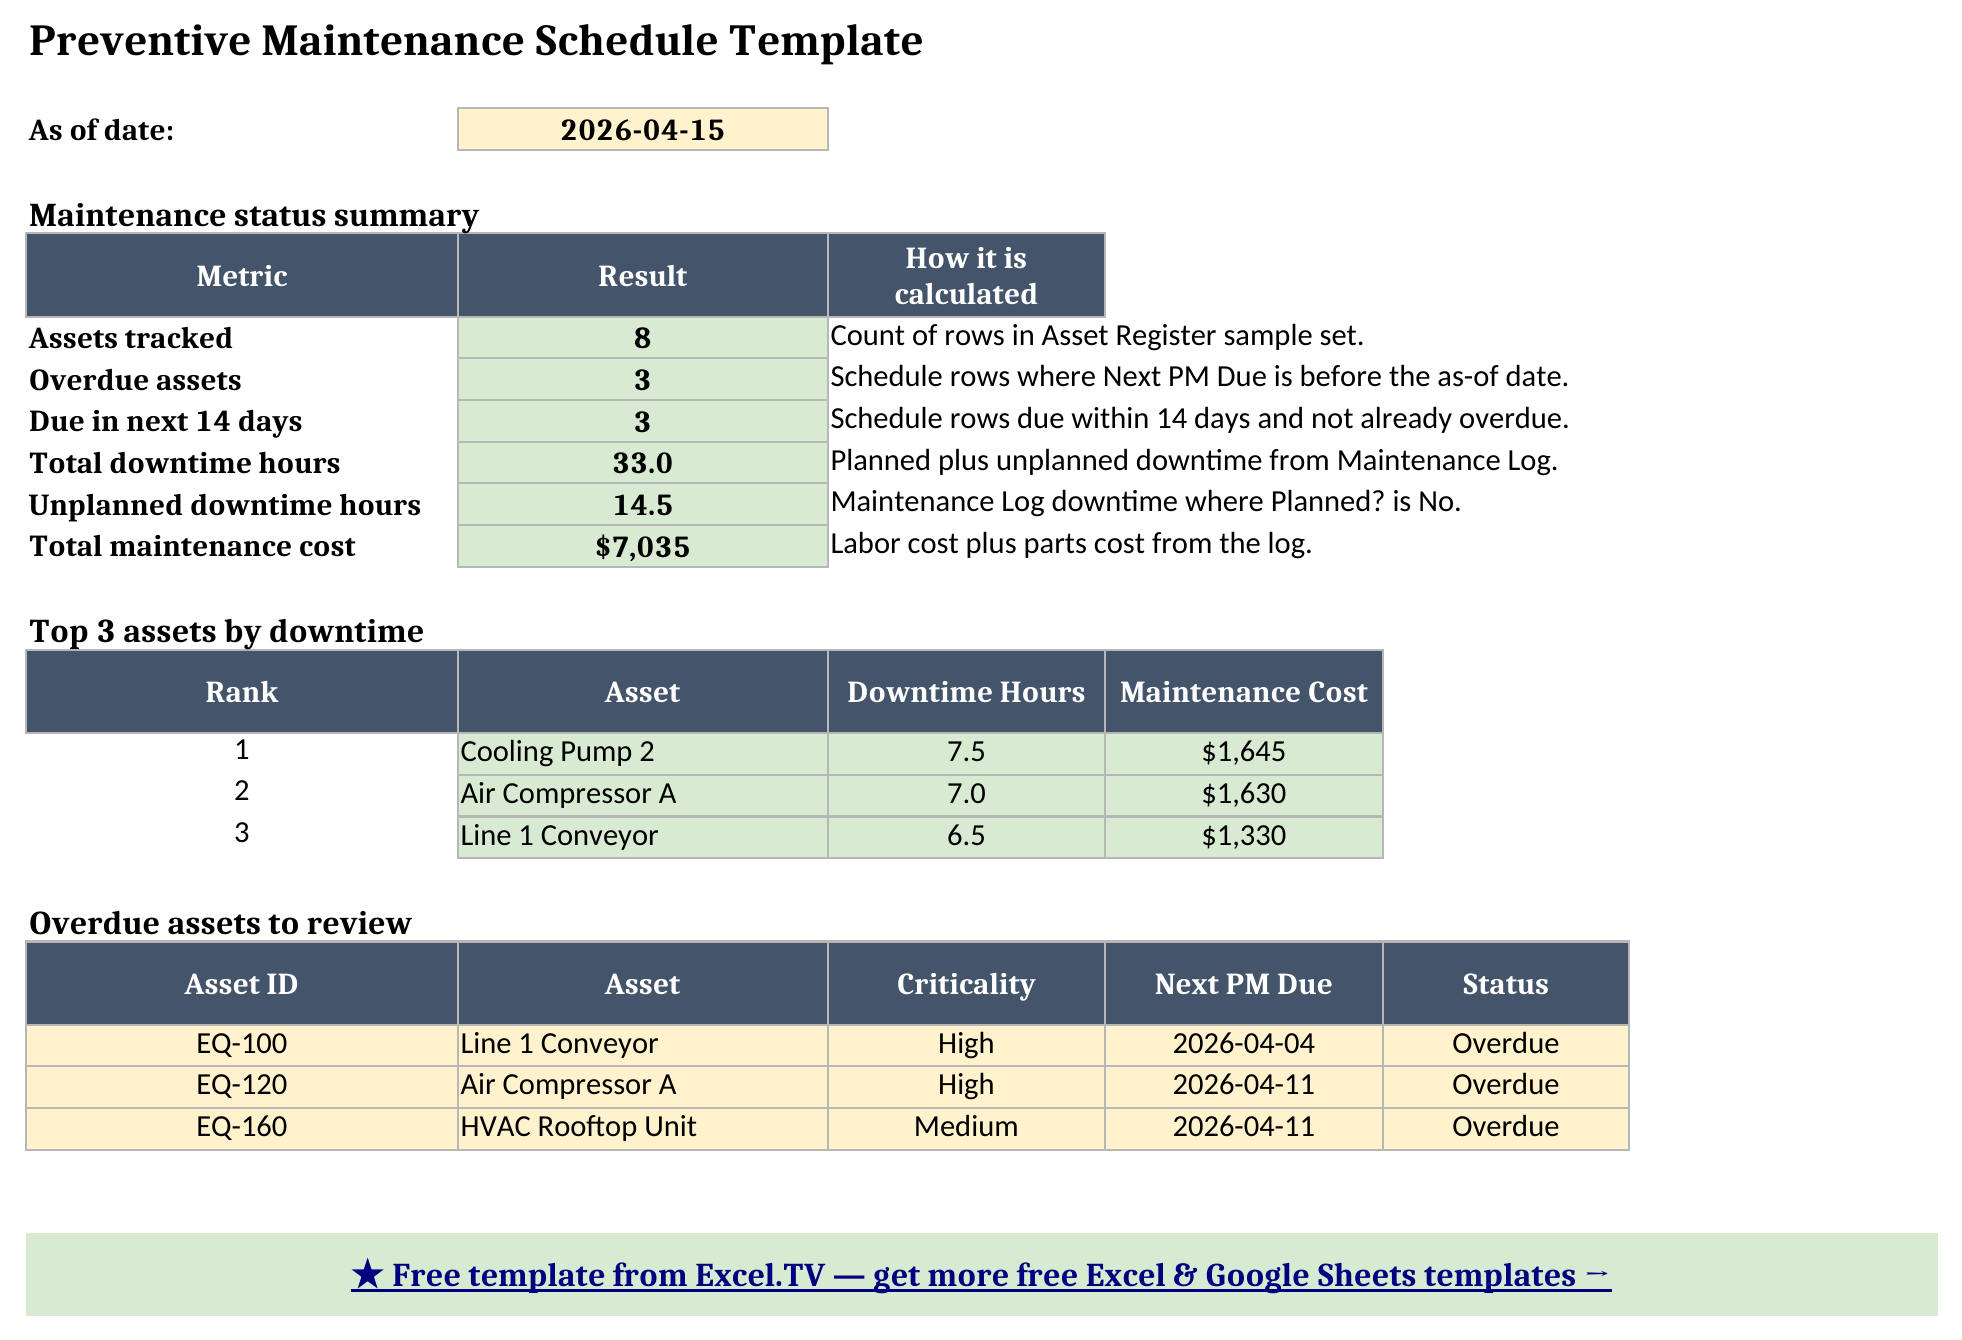
The sample workbook tracks eight synthetic assets as of April 15, 2026. The Dashboard output, recalculated from the generated workbook, is:
| Metric | Result |
|---|---|
| Assets tracked | 8 |
| Overdue assets | 3 |
| Due in next 14 days | 3 |
| Total downtime hours | 33.0 |
| Unplanned downtime hours | 14.5 |
| Total maintenance cost | $7,035 |
The three overdue assets are Line 1 Conveyor, Air Compressor A, and HVAC Rooftop Unit. Line 1 Conveyor was last serviced on March 5 with a 30-day PM frequency, which makes its next PM due April 4. Against an April 15 as-of date, it is 11 days overdue. Air Compressor A was last serviced on February 10 with a 60-day frequency, making it due April 11. HVAC Rooftop Unit was last serviced on December 12 with a 120-day frequency, also making it due April 11.
The due-soon group is Cooling Pump 2, Forklift 3, and Backup Generator. Cooling Pump 2 is due April 27, Forklift 3 is due April 20, and Backup Generator is due April 28, so all three fall within the 14-day due-soon window without being overdue.
The top downtime assets in the sample dashboard are Cooling Pump 2 at 7.5 hours and $1,645, Air Compressor A at 7.0 hours and $1,630, and Line 1 Conveyor at 6.5 hours and $1,330. That is the conversation I want the dashboard to create. The overdue list tells me which PMs are late; the downtime ranking tells me where reliability pain is concentrated. When those two lists overlap, I know where I would start.
How to use this in Google Sheets
Google Sheets is part of the intended delivery for this maintenance log google sheets workflow. This phase does not require a live Drive-owned copy link, and I am not going to invent one. Use the .xlsx directly:
- Download the workbook from the Excel template link.
- Open Google Sheets.
- Choose File > Import > Upload.
- Select the downloaded
.xlsxfile. - Choose Insert new sheet(s) or create a new spreadsheet from the upload.
- Review the Schedule and Dashboard sheets after import.
No formula substitutions are required for the workbook as authored. The formulas are limited to SUM, SUMIF, SUMIFS, IF, IFERROR, INDEX, MATCH, ABS, ROUND, LARGE, and arithmetic. Those functions are native to Excel and Google Sheets. Data validation dropdowns are also standard spreadsheet validation, so the Asset ID, service type, planned flag, condition rating, and criticality lists are portable.
The one thing I always check after a Google Sheets import is visual formatting. Conditional colors, row heights, and print sizing can render slightly differently between spreadsheet engines. The calculations are intentionally plain; the visuals are the only part I would inspect before sending the file to a team.
How to customize the template safely
Start by replacing the sample rows on Asset Register. Keep the same columns and keep Asset ID unique. If you add assets beyond the sample eight, copy the formulas down on Schedule and Downtime Summary so those new assets flow into the dashboard.
Then replace Maintenance Log with your own completed work. I recommend leaving the calculated Asset Name, Total Cost, and Count Helper columns in place. They are there to catch bad IDs, calculate cost consistently, and make the summary formulas easier to understand.
If your team defines due soon differently, edit the Due Soon Flag formula on Schedule. The sample uses 14 days because that gives a practical two-week planning window. A facility team might prefer 30 days. A high-volume production line might prefer 7 days. The formula is intentionally visible so you can change the threshold without rewriting the workbook.
If you want a preventive maintenance checklist template excel workflow, add checklist detail to Maintenance Log or create a separate checklist tab by asset type. I did not include a long universal checklist because equipment checklists vary too much. A conveyor inspection, generator test run, HVAC filter change, and forklift safety check do not belong in one generic checklist column. The schedule should tell you what is due; your procedure should tell the technician exactly how to do it.
Limitations to know before relying on it
A few limitations are worth calling out clearly:
- The schedule depends on Last PM Date. When preventive work is completed, update Last PM Date on Asset Register. The workbook does not automatically infer the latest PM date from Maintenance Log.
- It is not a work-order system. There are no automated reminders, assignments, approvals, photos, spare-parts inventory, or mobile forms.
- Formula ranges are sized to the sample. You can add assets and log rows, but you need to copy formulas and extend references deliberately.
- Top-3 ties are not specially broken. The dashboard uses
LARGEplusMATCH, so if two assets have exactly the same downtime total, the first matching asset appears first. - Spreadsheet dates need discipline. If your team types text that looks like a date but is not a real spreadsheet date, due-date math will not behave correctly.
- The video is local, not externally published. The embedded walkthrough is a repository artifact, not a claimed YouTube, Vimeo, or Drive upload.
I built the file this way because a preventive maintenance spreadsheet should be easy to inspect. The formulas are visible, the sample data is synthetic, the inputs are separated from the outputs, and the dashboard numbers tie back to ordinary worksheet rows. That is the difference between a tracker people can maintain and a pretty download that falls apart the first time someone adds a machine.
Grab the preventive maintenance schedule template, replace the sample assets with your own equipment, and use the dashboard to make your next maintenance review less dependent on memory.
