
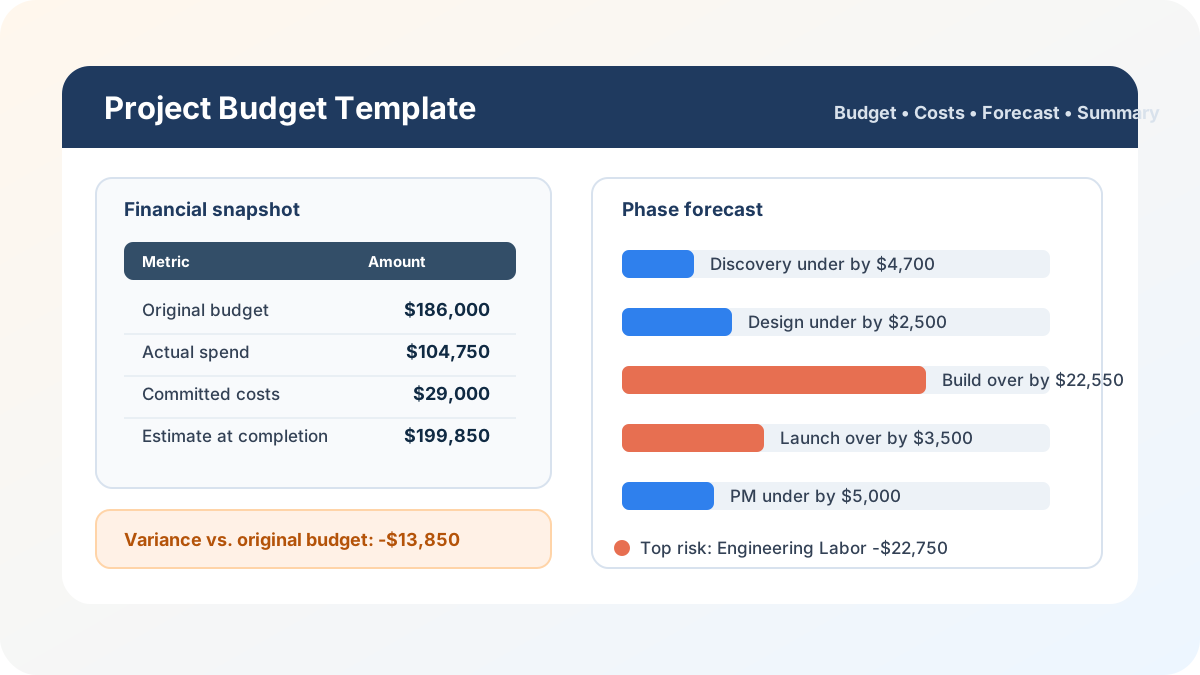
I reach for a project budget tracker whenever a project is too large for a single “spent so far” number but not large enough to justify a dedicated project finance system. The trap I see over and over is that a team has a budget in one tab, invoices in another place, purchase orders in email, and a status deck that says “on budget” because nobody has pulled the forecast together yet. This project budget template google sheets and Excel workbook is built to close that gap: baseline budget, actual spend, committed costs, estimate to complete, estimate at completion, and a one-page summary that tells you whether the project is still financially under control.
Download the Excel project budget template or open the published Google Sheets version — both are ungated, with no macros, no external data connections, and no sign-up. Use the .xlsx in Excel, or start from the native Google Sheets copy and replace the synthetic project data with your own.
Who is this template for?
I built this for project managers, operations leads, finance partners, agency owners, and internal teams that need a practical project cost tracker without turning the workbook into accounting software. If you are tracking a software launch, a client implementation, a facilities project, a consulting engagement, or a cross-functional initiative with multiple phases, you need more than a running total of invoices. You need to know what was budgeted, what has already been spent, what has been committed but not fully spent, what remains to finish, and whether the final estimate is likely to land under or over the approved number.
That is the specific job this workbook does. It is not a Gantt chart, a task tracker, or a procurement system. It does not try to schedule every activity or approve invoices. It gives you a clean project financial dashboard template where each cost category has an original budget, actuals, commitments, an ETC input, and a calculated EAC. That is the view I want in front of me before I tell a sponsor that a project is healthy.
What’s in the workbook, sheet by sheet
The workbook ships with six sheets, in this exact order:
- Instructions — setup steps, a color legend, Google Sheets import notes, limitations, and a clean-room disclosure. Every formula, layout, and sample figure in this workbook was authored from scratch for Excel.TV; no vendor workbook, report, layout, sample data, branding, or connector behavior was downloaded, inspected, or adapted.
- Project Setup — project name, sponsor, project manager, dates, project status, contingency percentage, and review threshold. These are the project-level assumptions I want visible before anyone starts debating line items.
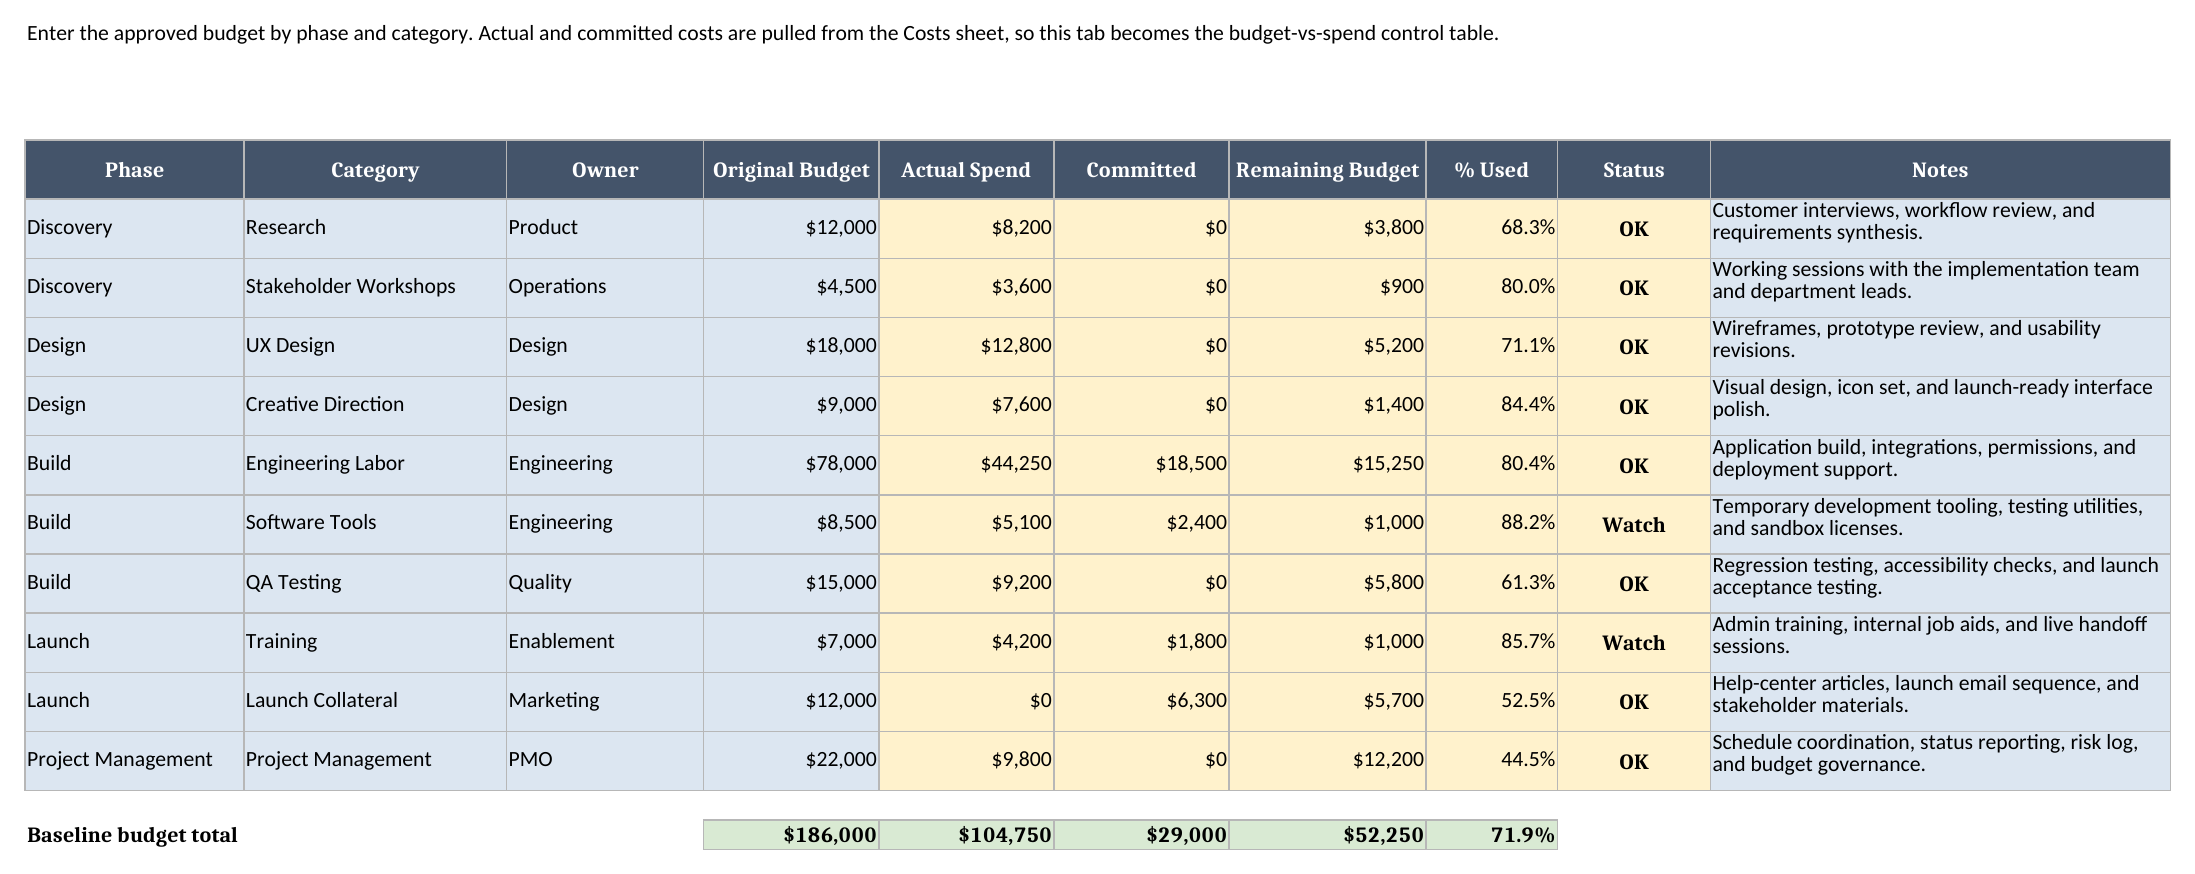
- Budget — the approved baseline budget by phase and category. It also pulls actual and committed spend from the Costs sheet so you can see how much budget is already consumed.
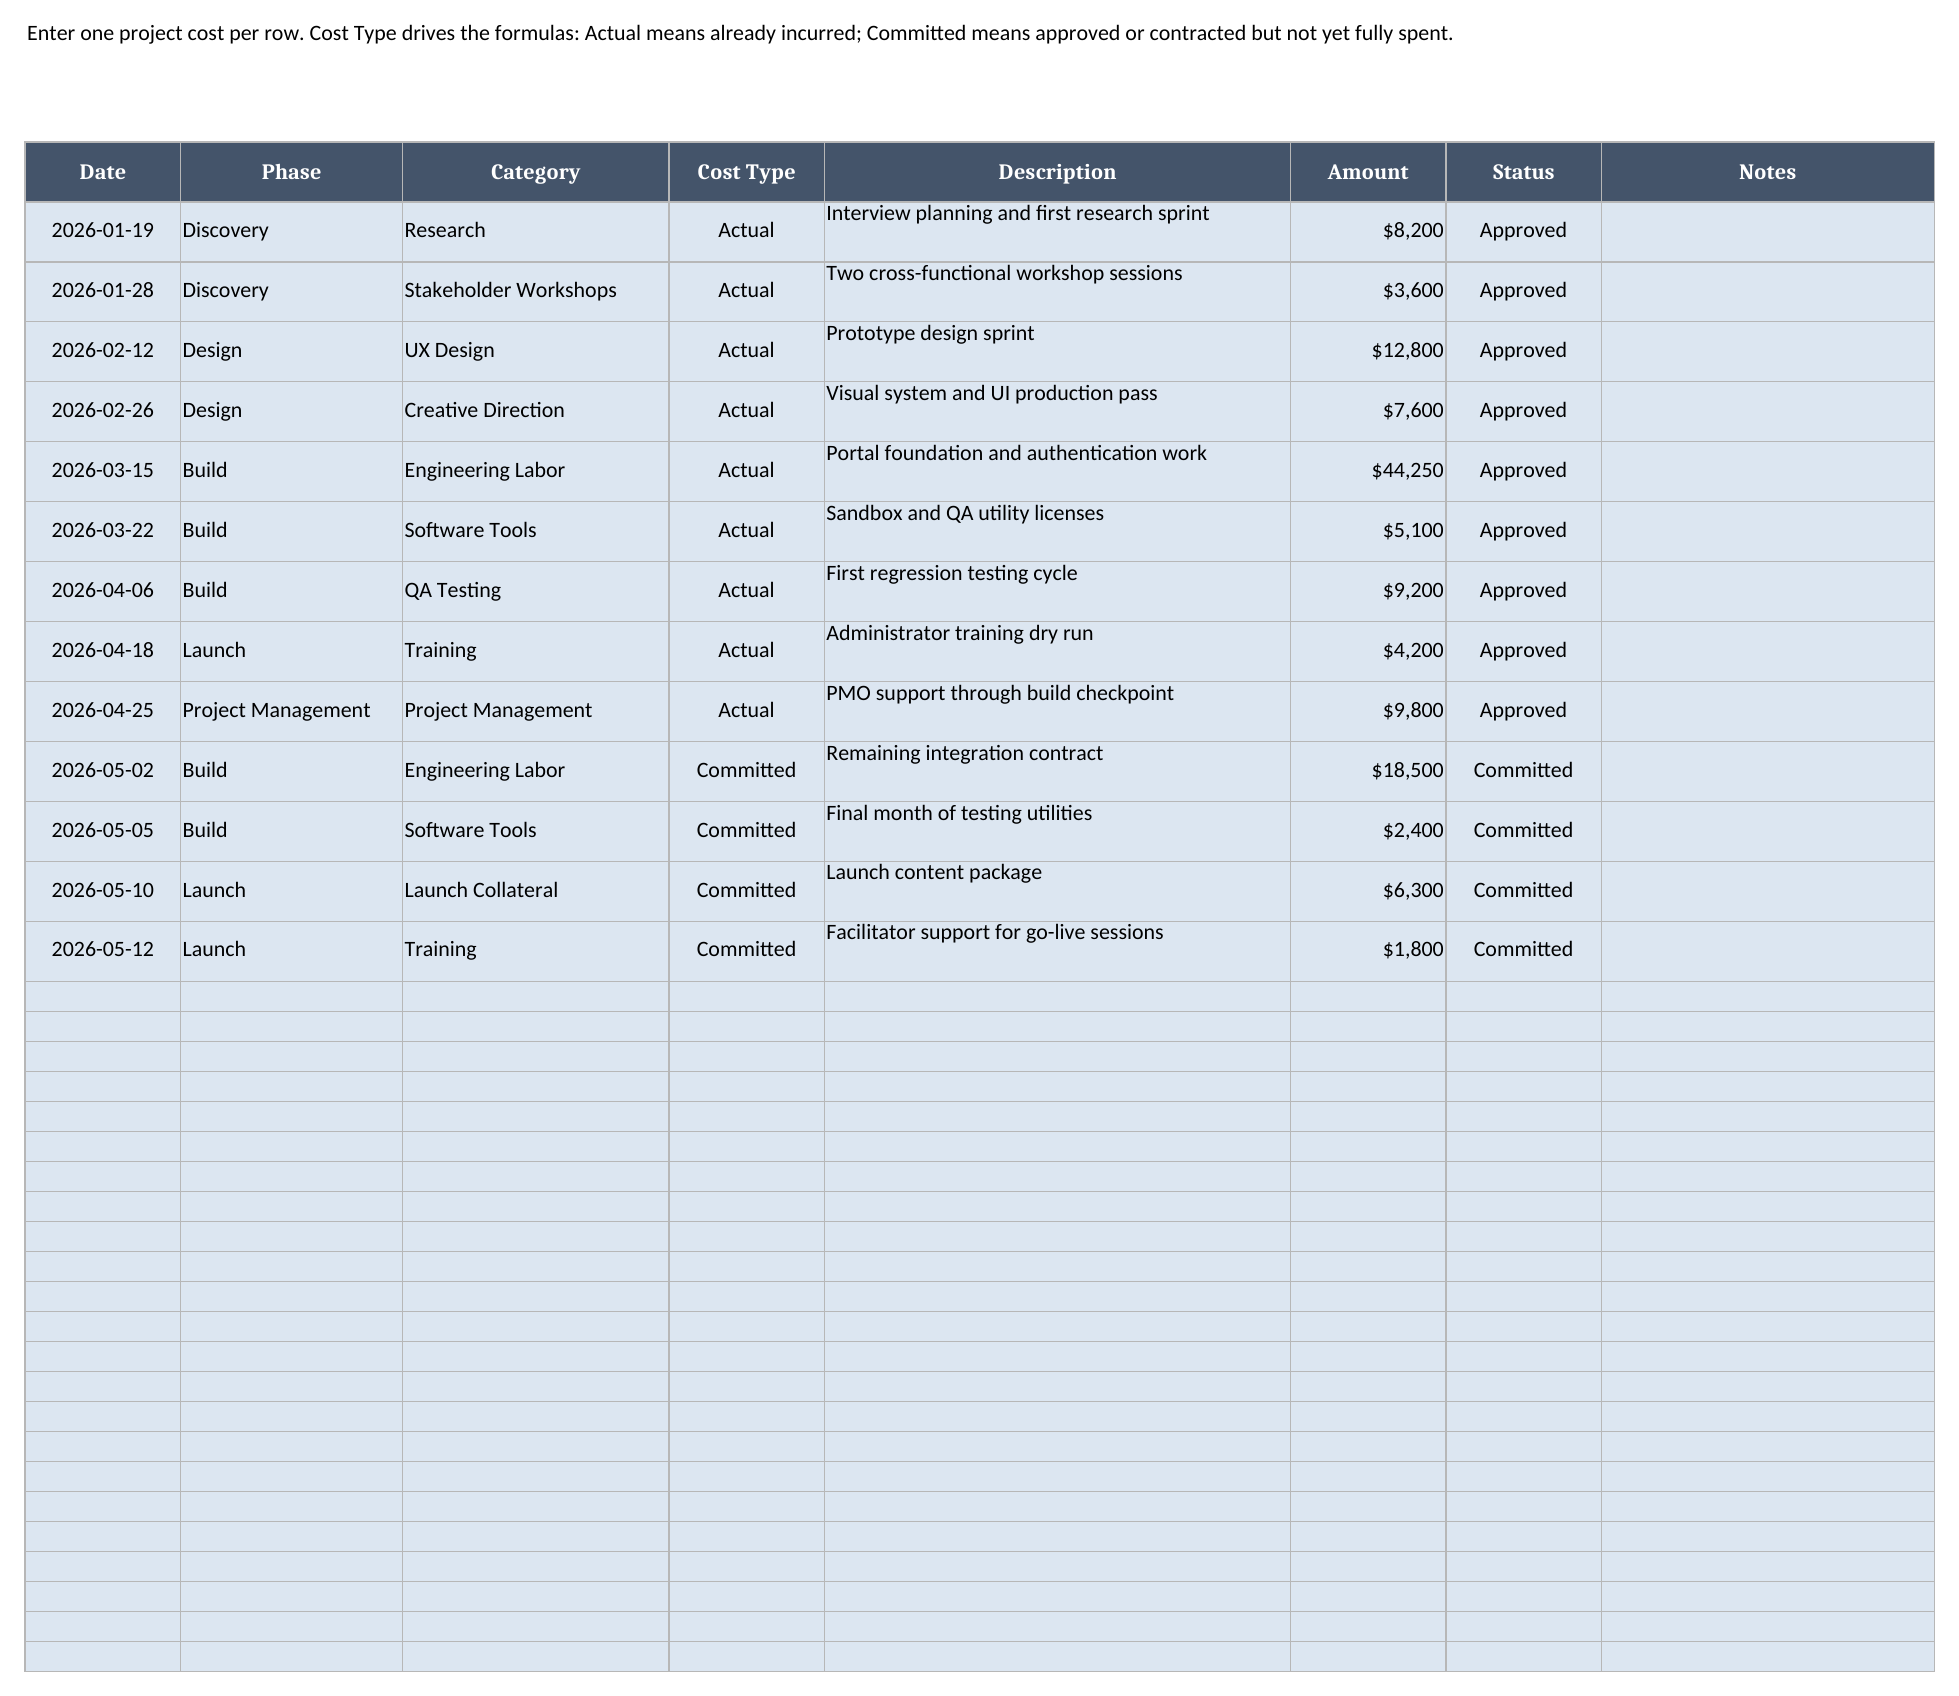
- Costs — the transaction-style project cost log. Each row has a date, phase, category, cost type, description, amount, status, and notes.
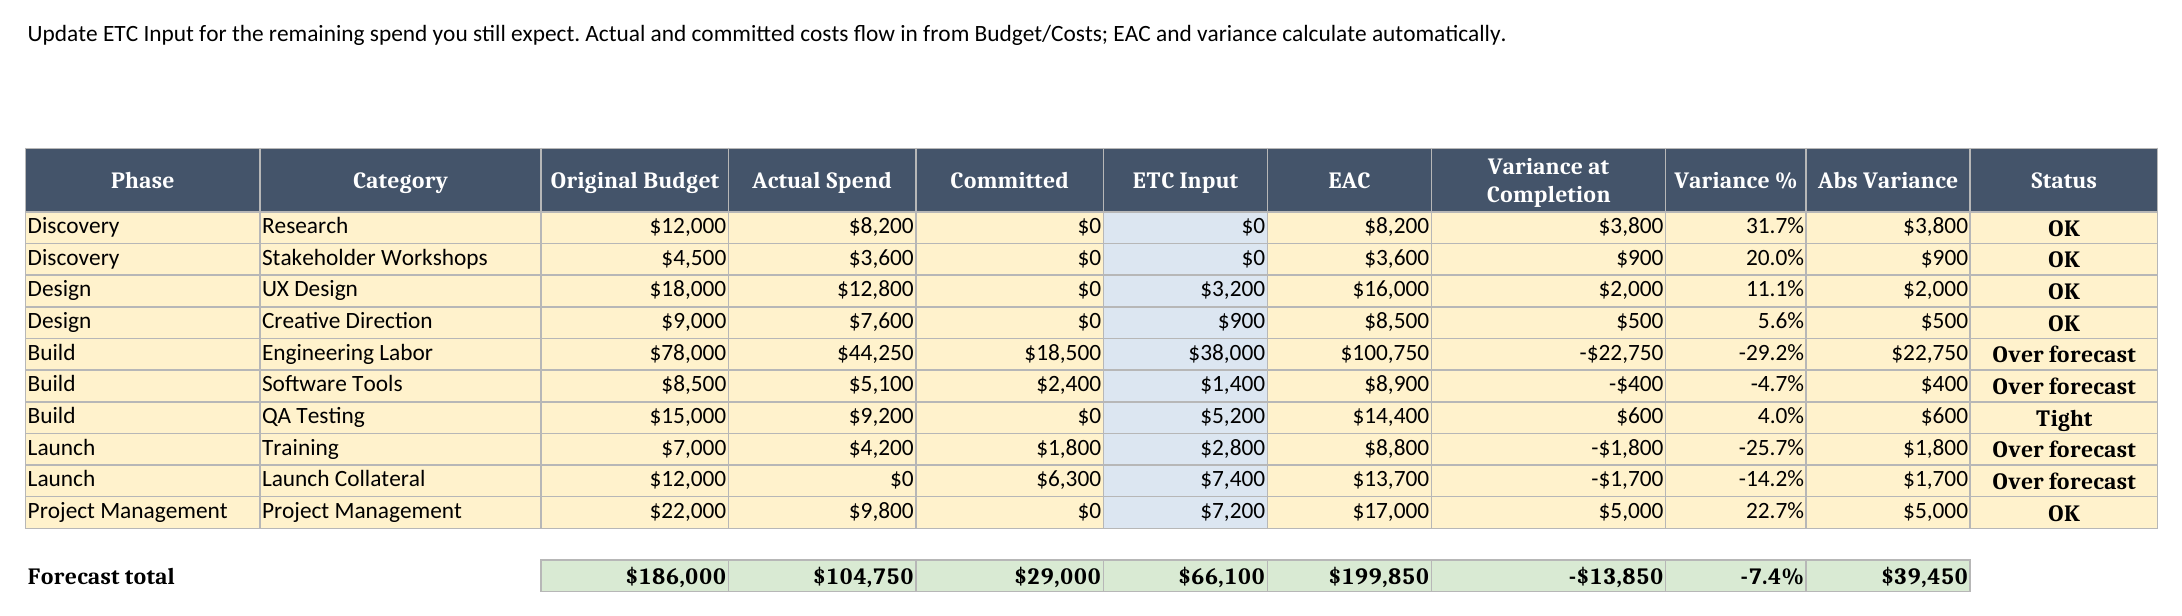
- Forecast to Complete — the calculation engine. It combines original budget, actual spend, committed costs, and the editable ETC Input column to calculate EAC and variance at completion.
- Project Summary — the dashboard: total budget, contingency, actual spend, committed costs, ETC, EAC, variance, phase rollups, and the top three variance categories.
The required inputs are the project setup fields, each budget line’s phase/category/owner/original budget, the cost log entries, and the ETC Input values on Forecast to Complete. The main outputs are remaining budget, percent used, EAC, variance at completion, total forecast variance, remaining contingency, phase-level EAC, and the top variance ranking.
How do I set up the project budget tracker?
- Open Project Setup and replace the sample project name, sponsor, project manager, dates, status, contingency percentage, and review threshold.
- Open Budget and replace the synthetic budget categories with your own. Keep category names unique unless you also revise the formulas to use a combined phase/category key.
- Open Costs and enter every actual invoice, internal labor charge, committed purchase order, or known future contract as one row.
- Use Cost Type deliberately: choose
Actualfor costs already incurred andCommittedfor costs approved or contracted but not fully spent yet. - Open Forecast to Complete and update ETC Input with the remaining spend you still expect, category by category.
- Open Project Summary and review the project-level EAC, variance, phase rollup, and top three variance categories before you update your sponsor or steering group.
I separated actuals, commitments, and ETC because those numbers answer different questions. Actual spend tells you what has already happened. Commitments tell you what is already financially locked in. ETC is judgment: what you still believe it will take to finish. When those three are mashed together in one manual “forecast” cell, you lose the audit trail. In this workbook, the math stays visible.
How the budget, costs, and forecast connect
The Budget sheet is the baseline. In the sample workbook, the Northstar Client Portal Launch has ten budget categories across Discovery, Design, Build, Launch, and Project Management. The original baseline budget is $186,000, and the workbook calculates that total with SUM from the Budget table.
The Costs sheet is intentionally closer to a register than a dashboard. I want one row per cost event because that structure is easy to audit. If an engineering contract is partially spent and partially committed, it should not be hidden in one blended number; record the actual cost as an Actual row and the remaining signed amount as a Committed row. The Budget sheet then uses SUMIFS to pull costs by phase, category, and cost type. That gives each budget line a live actual amount, a live committed amount, remaining budget, percent used, and a status label.
Forecast to Complete is where I do the part that matters most in a project review. For each category, EAC is calculated as:
Actual Spend + Committed Costs + ETC InputVariance at Completion is:
Original Budget - EACThat sign convention is deliberate. Positive variance means the category is forecast under budget. Negative variance means it is forecast over budget. I would rather see -$22,750 for Engineering Labor than a positive “overrun” number that I have to mentally flip while reading the dashboard.
Worked example: reading the sample project
The sample project in the workbook is a synthetic client portal launch. I built it with enough moving pieces to behave like a real project review: Discovery is mostly done and under budget, Design is close to done, Build is where the pressure is, Launch has commitments and remaining work, and Project Management still has unused budget.
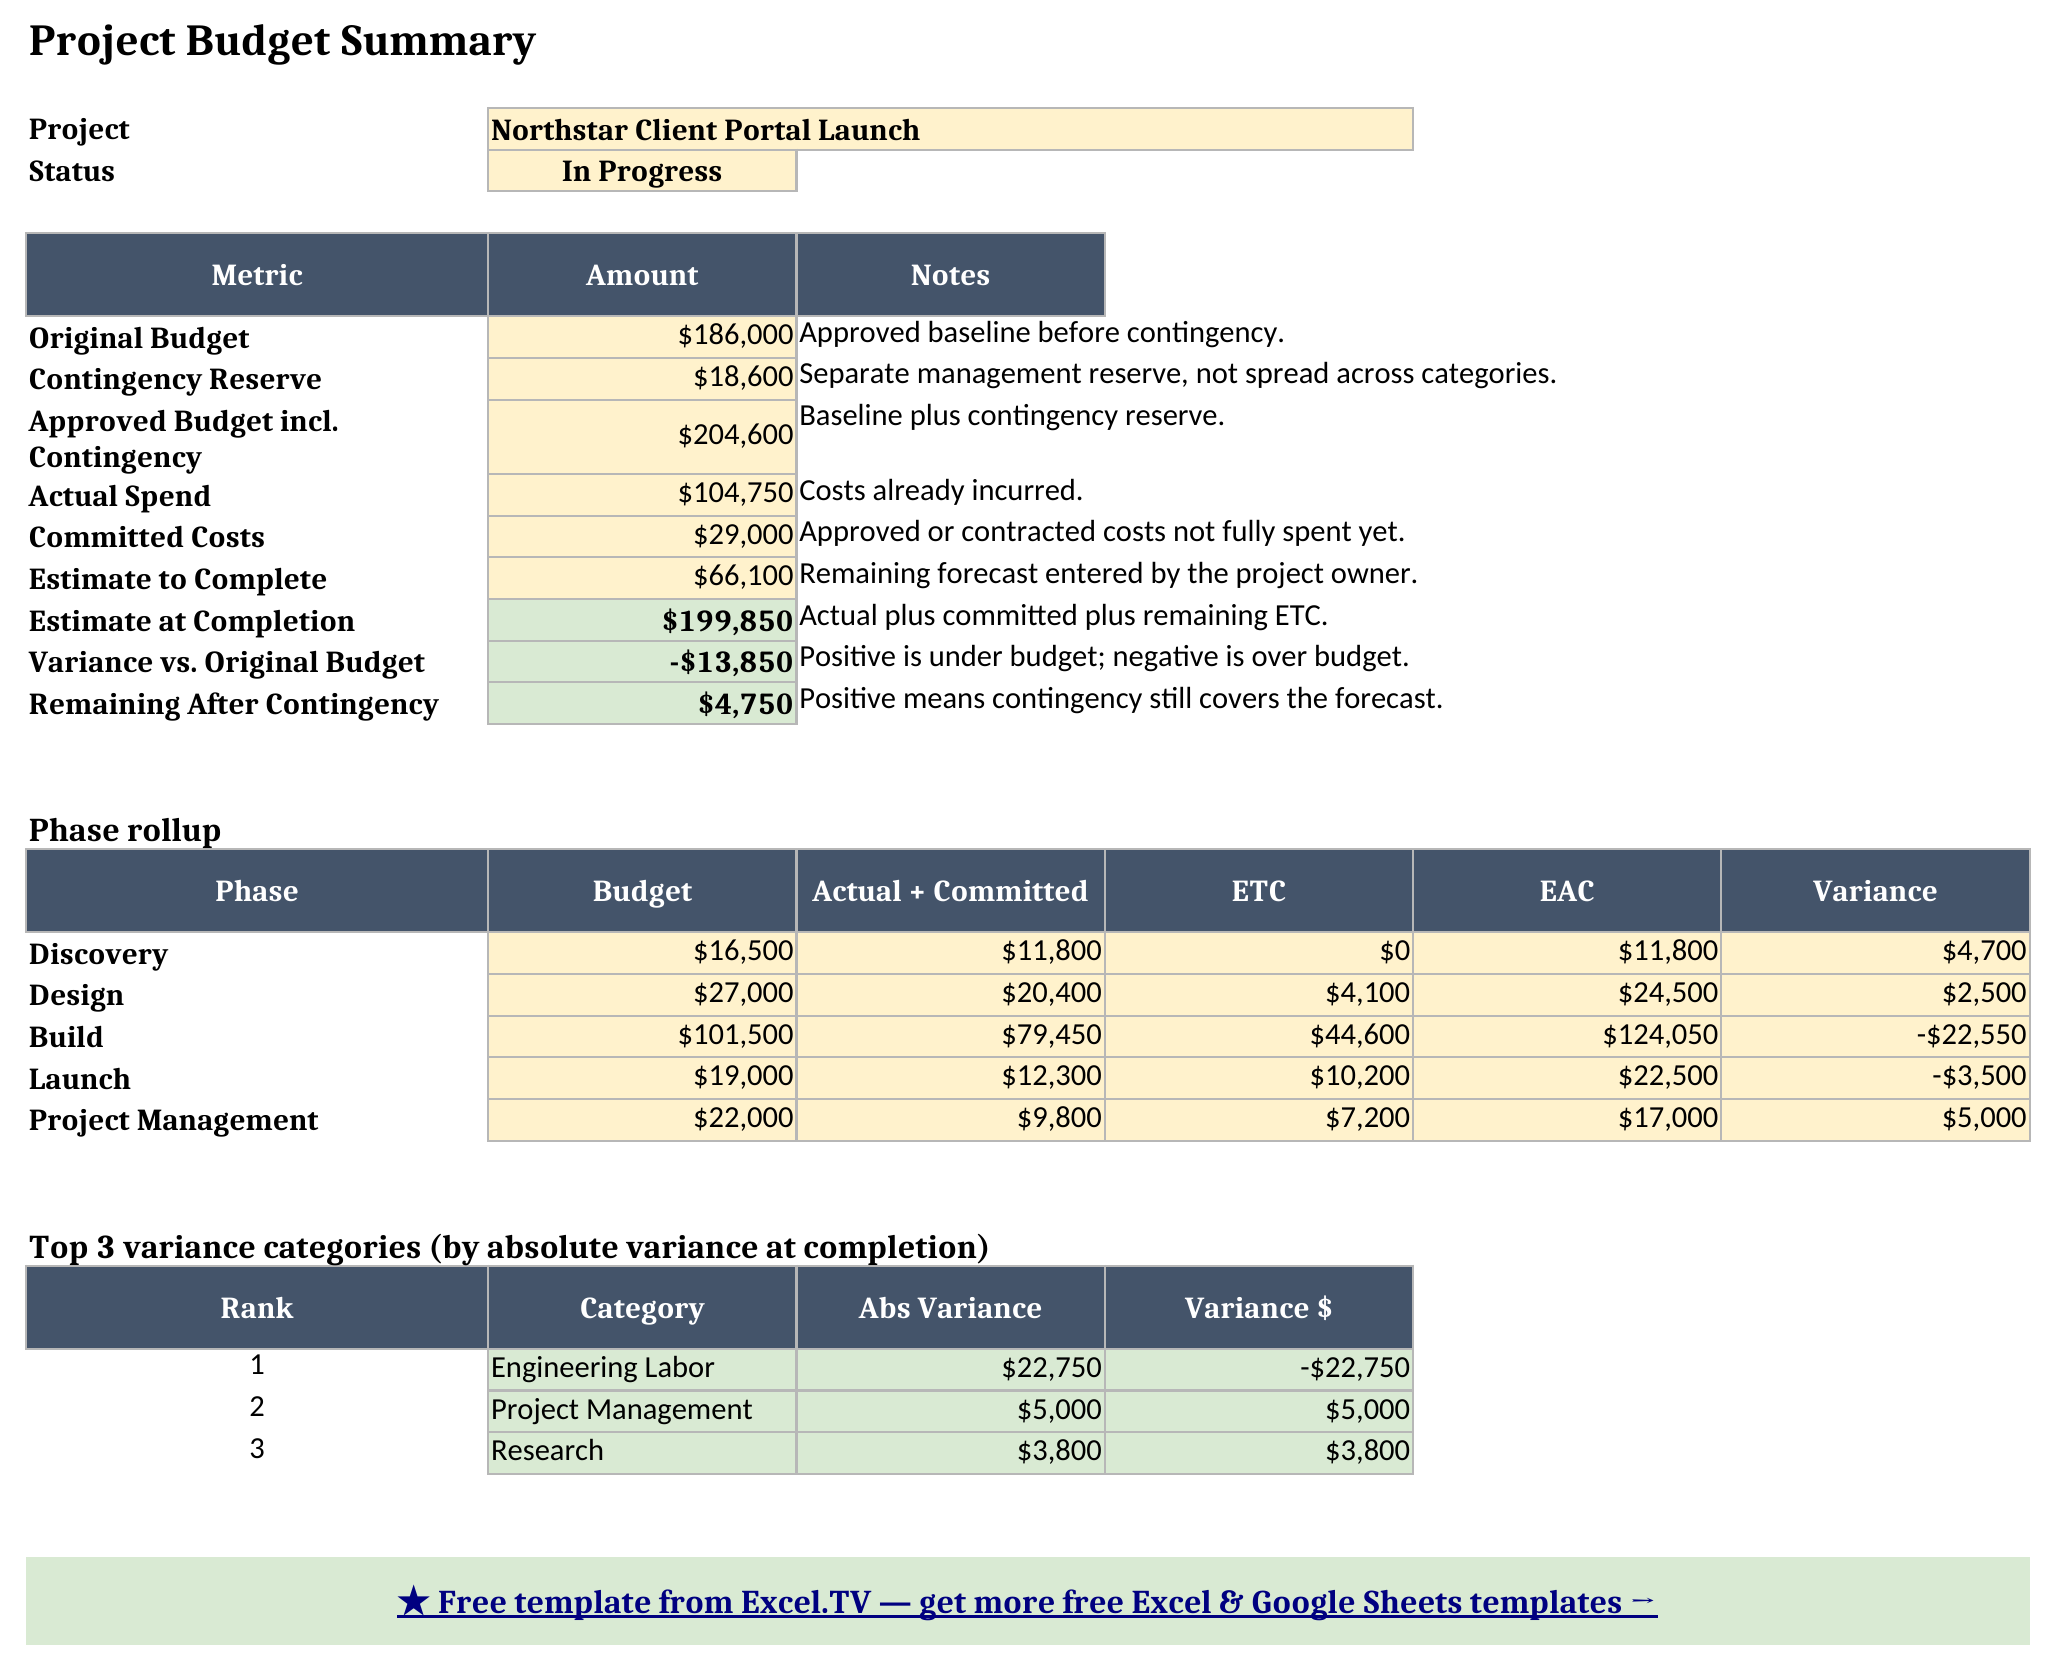
Here are the recalculated workbook totals from Project Summary:
| Metric | Value |
|---|---|
| Original Budget | $186,000 |
| Contingency Reserve (10%) | $18,600 |
| Approved Budget incl. Contingency | $204,600 |
| Actual Spend | $104,750 |
| Committed Costs | $29,000 |
| Estimate to Complete | $66,100 |
| Estimate at Completion | $199,850 |
| Variance vs. Original Budget | -$13,850 |
| Remaining After Contingency | $4,750 |
Those numbers tell a more useful story than “we have spent $104,750.” The project is only about $104,750 into actuals, but it already has another $29,000 committed and $66,100 still expected to complete. That puts the EAC at $199,850. Against the original $186,000 baseline, the project is forecast -$13,850 over budget, or about 7.4% over the baseline. Against the approved budget including 10% contingency, it still has $4,750 of reserve left.
The phase rollup explains where the pressure is:
| Phase | Budget | Actual + Committed | ETC | EAC | Variance |
|---|---|---|---|---|---|
| Discovery | $16,500 | $11,800 | $0 | $11,800 | $4,700 |
| Design | $27,000 | $20,400 | $4,100 | $24,500 | $2,500 |
| Build | $101,500 | $79,450 | $44,600 | $124,050 | -$22,550 |
| Launch | $19,000 | $12,300 | $10,200 | $22,500 | -$3,500 |
| Project Management | $22,000 | $9,800 | $7,200 | $17,000 | $5,000 |
Build is the problem. It has a $101,500 budget, but actual plus committed costs are already $79,450, and the remaining ETC is $44,600, which puts Build at a $124,050 EAC. That is -$22,550 over budget at the phase level. The top category ranking is even more specific: Engineering Labor is forecast -$22,750 over its category budget. Project Management is $5,000 under, and Research is $3,800 under, but those savings do not fully offset the Build pressure.
That is why I like this layout. A sponsor can see the headline answer in one row: EAC is $199,850. The project manager can see the operational answer one section lower: Build is the phase to manage. The finance partner can see the audit trail: the overrun comes from actuals, commitments, and ETC, not a manually typed dashboard number.
How do I use this in Google Sheets?
Google Sheets is a first-class destination for this template. I published a native Google Sheets copy here: open the project budget template in Google Sheets. You can use that shared reader version as your starting point, then choose File > Make a copy to save your own editable copy in Drive.
No formula substitutions are required. The workbook uses only SUM, SUMIFS, IF, IFERROR, INDEX, MATCH, ABS, ROUND, LARGE, and ordinary arithmetic. Those functions are supported in Google Sheets, and the phase/category/status dropdowns carry over as data validation. In the published Sheets copy, check Project Summary against the sample numbers above: Original Budget should be $186,000, EAC should be $199,850, and Remaining After Contingency should be $4,750. If those three match, the sheet is calculating correctly.
If you prefer to control the import yourself, download the .xlsx, open Google Sheets, choose File > Import > Upload, select the workbook, and choose Insert new sheet(s). You can also upload the file to Google Drive, right-click it, choose Open with > Google Sheets, and then use File > Save as Google Sheets if you want a separate native Sheets copy in your Drive.
What to customize before you rely on it
The first thing I would customize is the category list. The sample categories are generic enough to teach the workbook, but your categories should match how your project is funded and reviewed. If your sponsor approves budget by workstream, use workstreams. If finance tracks by GL-style cost bucket, use those buckets. The workbook is most useful when the categories line up with the conversation you actually have in a project review.
The second thing I would customize is the contingency percentage. In the sample workbook, contingency is 10%, shown separately from the original budget. I prefer that because it keeps the baseline honest. If you spread contingency across every row, the project can look healthier than it is until the reserve is gone. Showing it separately makes the conversation clearer: are we over the original baseline, and if so, is the reserve enough to cover it?
The third thing is the review threshold on Project Setup. The sample threshold is 5%. Forecast to Complete uses that threshold to distinguish a small tight variance from a more meaningful forecast issue. Some teams will want a tighter threshold for fixed-fee work and a looser one for early-stage internal projects. The formula is visible, so you can change the threshold without rewriting the workbook.
Limitations to know before you rely on this
A few things are worth knowing before you put real project dollars in:
- Category names are assumed to be unique. The sample formulas use phase and category together in Budget, and category lookups in the top-3 ranking. If you need the same category name under multiple phases, add a unique combined key before you scale the workbook.
- This is a forecast-at-completion model, not a cash-flow model. It does not spread payments by month or show when cash leaves the business. It answers what the project is expected to cost by completion.
- Committed costs require judgment. A signed purchase order belongs in Committed. A vague possibility does not. If you load soft guesses into Committed, you will make the cost log look more certain than it is.
- Top-3 ties are not broken. The
LARGEplusMATCHpattern returns the first matching category if two categories have the same absolute variance. That keeps the workbook compatible with Excel and Google Sheets without adding a helper key, but it is a known limitation. - No macros or external connections. Everything is native formulas and typed data. That is deliberate; it is what keeps the workbook portable between Excel and Google Sheets.
Once you keep those limits in mind, the workflow is straightforward: maintain the cost log, update ETC honestly, and review EAC before you call the project on budget. Download the project budget template and start replacing the sample launch project with your own numbers.
