
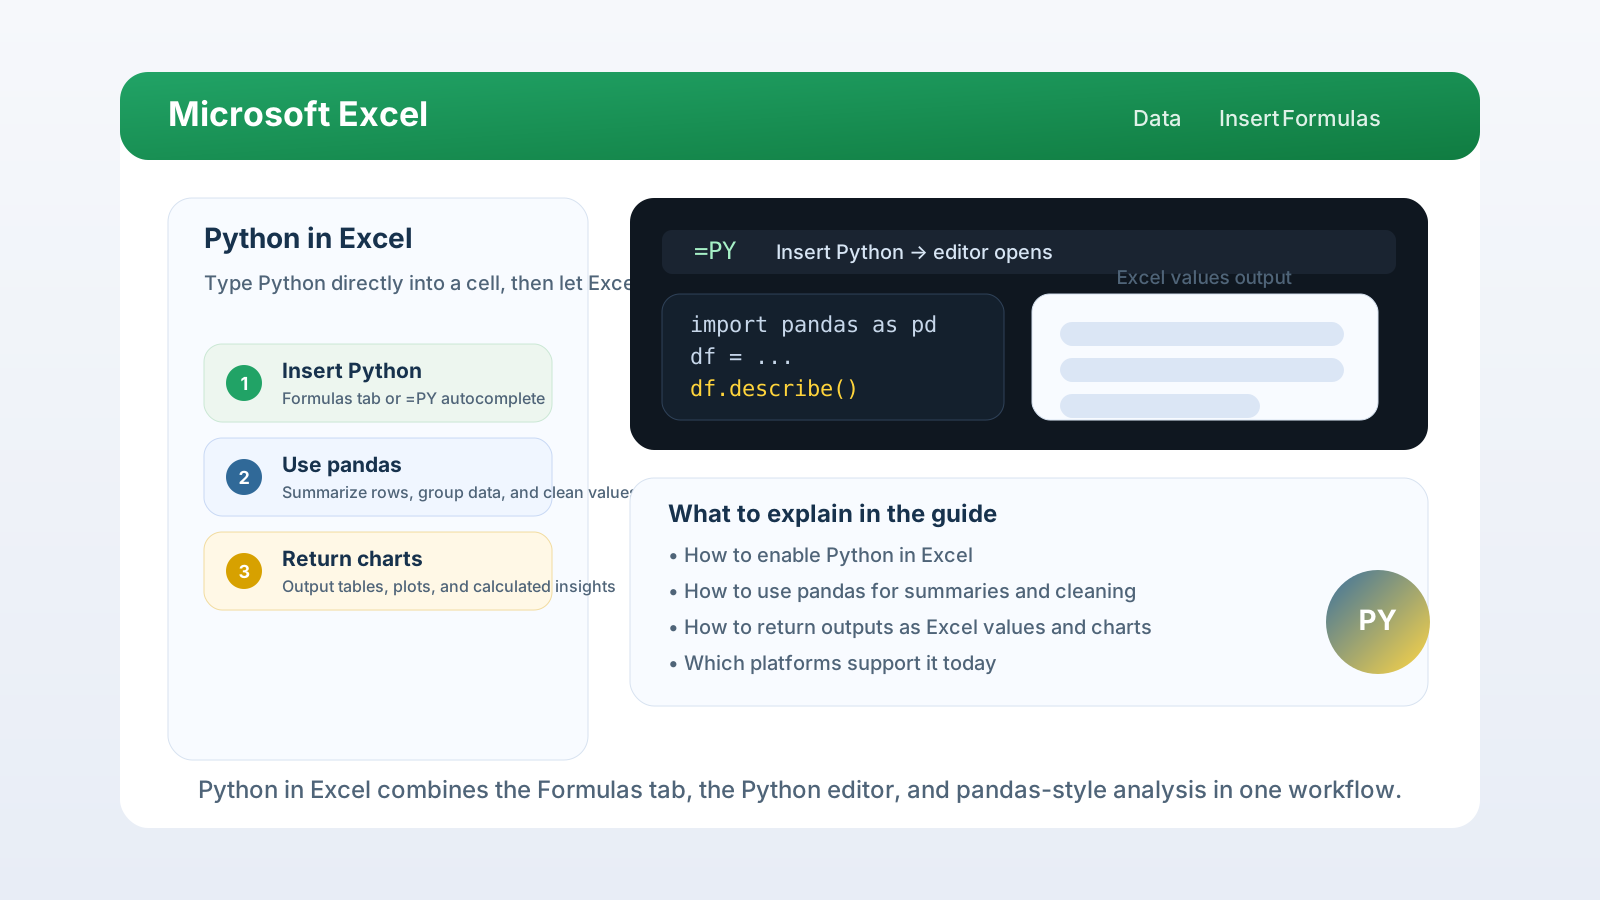
Python in Excel gives you a practical way to mix spreadsheet workflows with real Python analysis. If you need to clean data, summarize a table, build a chart, or inspect patterns with pandas, it is much easier than exporting data to a notebook and copying results back into a workbook. The big win is that the answer stays inside Excel.
Python adoption snapshot
Stack Overflow’s 2025 Developer Survey found that 57.9% of respondents reported doing extensive development work in Python during the previous year. That does not measure Excel use specifically, but it helps explain why a built-in Python workflow is useful to analysts who already know the language.
What is Python in Excel?
Python in Excel connects spreadsheet cells to Python analytics. It lets you run Python code directly in a cell, send the calculation to Microsoft’s cloud runtime, and return the result to the workbook without leaving the sheet. That makes it useful for analysis work that is too messy for normal formulas.
Microsoft Support also says Python in Excel comes with a core library set provided by Anaconda, so you can clean values, group rows, calculate summaries, and create visualizations without a local Python distribution.
The workflow remains spreadsheet-first: start in Excel, point Python at workbook data, then choose how the output returns.
Why people search for Python in Excel
People usually search for Python in Excel when they have outgrown formulas but do not want to move a workbook into a separate notebook or BI tool. Typical use cases include ad hoc data cleaning, quick statistical checks, richer charts, and repeatable transformations that are easier to express in pandas than in nested Excel functions.
If you are already comfortable with formulas, think of Python as a new layer rather than a replacement. Excel still handles cells, formatting, and workbook distribution. Python handles the logic that becomes awkward when a problem needs grouping, joining, or a multi-step transformation chain.
If you are still building those foundational formula and pivot-table skills, our Excel basics for data analysis guide is a good place to start before you add Python in Excel to the mix. And if you want the longer view of how far the pairing can go — matplotlib visualizations, scikit-learn models, and automation scripts alongside your workbooks — see the companion guide to Excel and Python.
How do you turn on Python in Excel?
You turn it on from the Formulas tab, and Microsoft’s current documentation says the simplest path is to open a blank workbook and select Insert Python. If your subscription supports the feature, you can also type =PY in a cell and pick the PY function from autocomplete. Either route leads to the same Python editing experience.
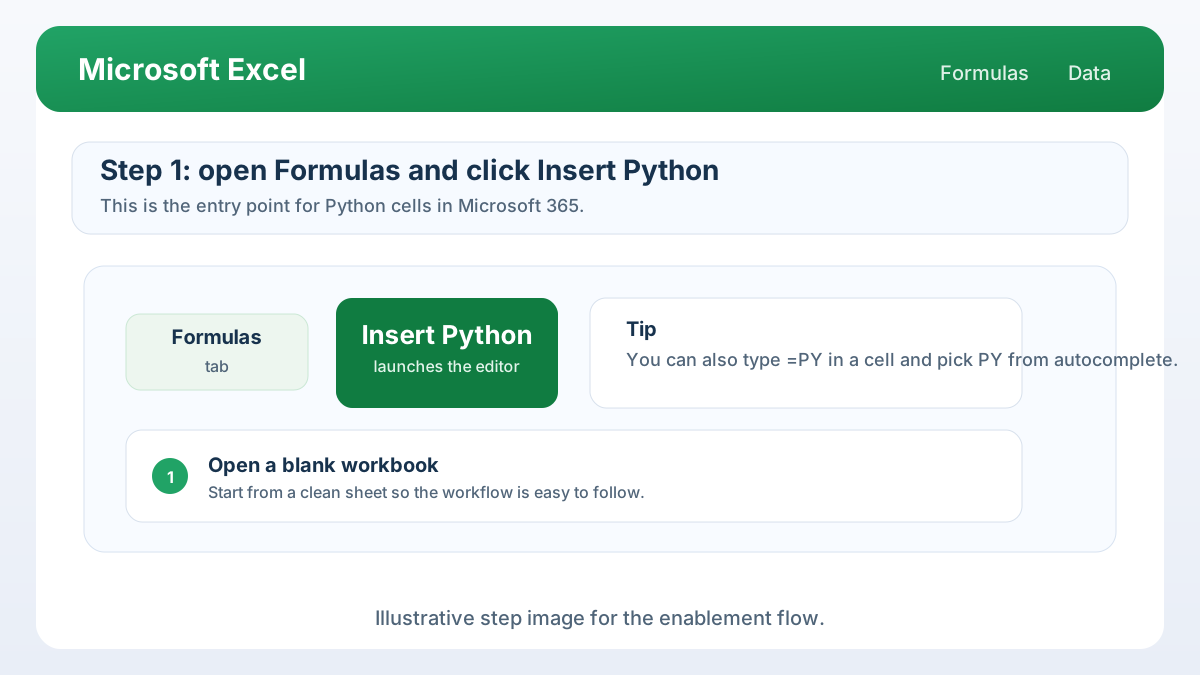
Use this checklist when you enable the feature for the first time:
- Open a blank workbook.
- Select Formulas in the ribbon.
- Select Insert Python.
- Wait for the Python editor to appear.
- Confirm that the workbook has internet access, because Microsoft says the feature runs in the cloud.
A useful detail from the current help pages is that the add-on license includes premium compute and more calculation mode options, so the experience can vary by plan.
For your first workbook, start with one small table, one cell formula, and one output. Confirm it works in your tenant before moving to larger analysis blocks.
What should you verify before you start?
Check three things before you write your first cell: the workbook opens in a supported platform, the account has access to Python in Excel, and the machine can reach the internet. If any of those pieces are missing, the cell may open but the calculation will not behave the way you expect.
How do you write your first Python cell?
Your first Python cell should be tiny. The goal is not to build a full model on day one; the goal is to prove that Python can read workbook data and return something simple, like a count, summary, or table. Once that works, you can layer in pandas and start asking better questions.
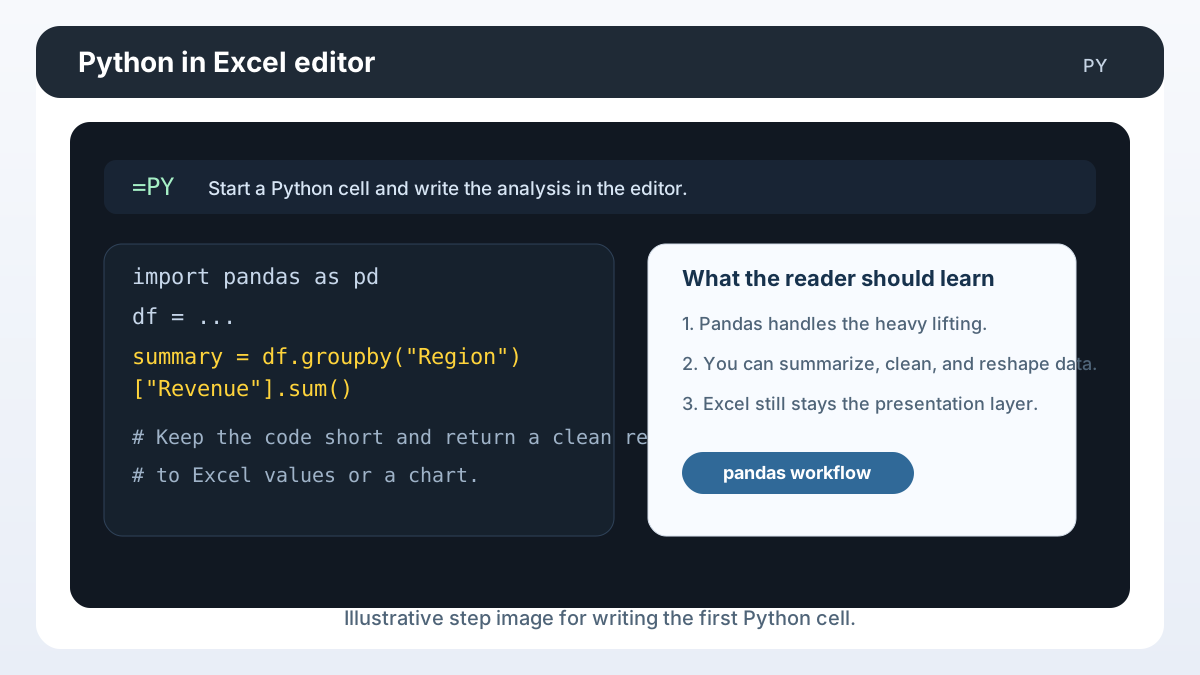
A practical first pattern looks like this:
- Put a small dataset into a table.
- Open a Python cell with Insert Python or
=PY. - Load the Excel range or table into Python.
- Ask pandas for a quick summary.
- Return the result back to Excel.
Microsoft’s current support content explains that Python in Excel uses the custom xl() function to interface between Excel and Python, and that xl() accepts Excel objects such as ranges, tables, queries, and names. That is the key bridge between the worksheet and the Python runtime. If you want to bring a table into pandas, xl() is the connection point.
A good starter example is to load a small sales table and ask for descriptive stats. In real work, that might mean checking revenue distribution, finding missing values, or grouping by region. The important part is that you can keep the data in the workbook and still use Python thinking.
For example, if the source is an Excel table named SalesTable, this Python cell reads the table with its headers and returns revenue grouped by region:
sales = xl("SalesTable[#All]", headers=True)
sales.groupby("Region", as_index=False)["Revenue"].sum()
Here is the mental model I recommend:
- Excel stores the source data.
- Python reads that data through
xl(). - pandas transforms it.
- Excel displays the result.
That pattern stays the same whether you are looking at ten rows or ten thousand.
How do you use pandas in Excel?
You use pandas in Excel the same way you would use it in a notebook, but with a workbook acting as the input and output layer. The short answer is that pandas is the best tool when you want to clean, reshape, group, or summarize workbook data without building a long chain of helper columns.
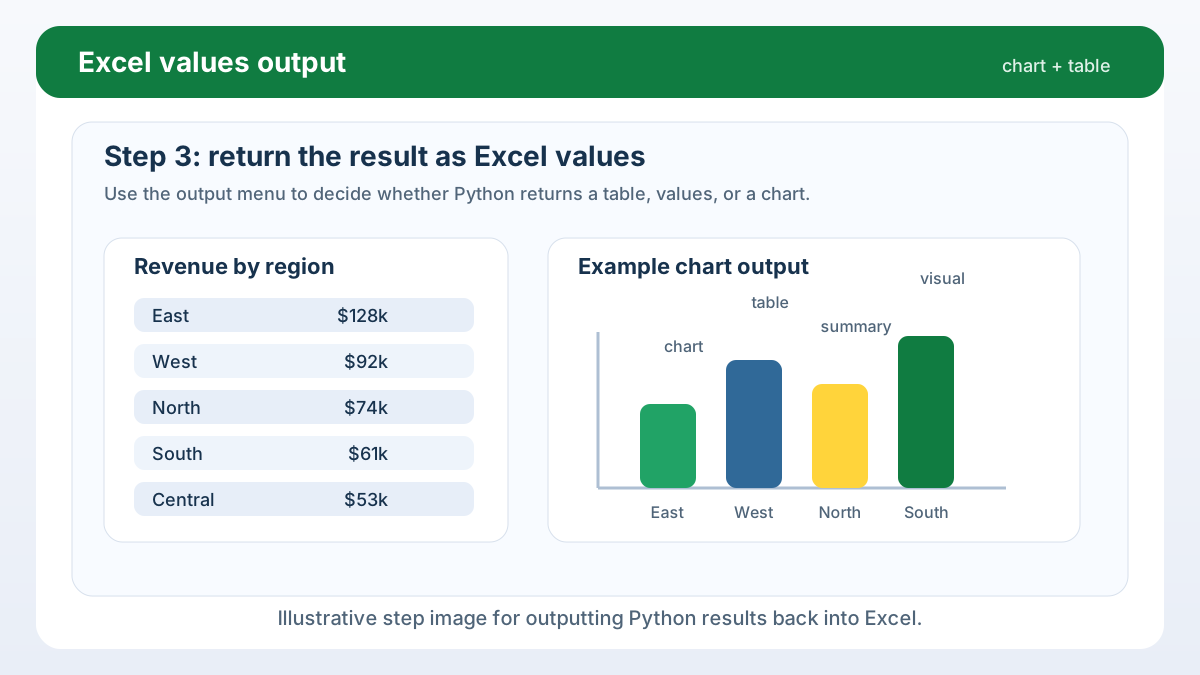
The most common pandas workflow in Excel is:
- Read the table into a DataFrame.
- Remove blanks or normalize text.
- Group by a field such as region, rep, or month.
- Calculate a summary such as sum, mean, count, or median.
- Return the result to Excel values.
That pattern keeps the workbook readable. A formula-heavy sheet can become difficult to audit once logic spans multiple tabs, while a pandas cell keeps transformation steps in one place. Taken together, those steps are exactly what someone searching “python data analysis excel” is trying to do: get pandas-level analysis without ever leaving the workbook.
If the “remove blanks or normalize text” step also needs to collapse repeat rows, pandas’ drop_duplicates() covers the same ground as Excel’s built-in Remove Duplicates command or the UNIQUE function, just with more control over which columns define a match and how ties get resolved.
Microsoft’s support pages also note that the Python code editor includes IntelliSense and text colorization, useful when an analysis involves several pandas steps.
A simple pandas use case is group-based reporting: group a sales table by region, sum revenue, and return a tidy summary to Excel for formatting, charting, or another worksheet formula.
That makes Python in Excel handy for repetitive reporting: keep a weekly summary in a reusable Python cell instead of rebuilding it by hand.
When pandas is better than formulas
Use pandas when the problem involves filtering rows, joining tables, pivot-style summaries, or multi-step text cleanup. Use normal formulas when you only need a quick row-by-row calculation. The dividing line is usually complexity: if the logic starts to feel like a mini ETL pipeline, pandas is the better fit.
What can Python in Excel return?
Python in Excel can return more than a plain number. The current support documentation says you can output a DataFrame as Excel values and then use those results in charts, formulas, and conditional formatting. That makes the feature much more useful than a one-way calculation tool, because the output can feed the rest of the workbook.
A good mental model is that Python can return three broad things:
- A single value for a quick check.
- A table of values for reporting.
- A chart or visualization for presentation.
Microsoft also says the feature works with Python libraries such as seaborn and Matplotlib for plotting. In other words, you can use Python to prepare the data and then produce a workbook-friendly result instead of exporting to an external charting tool.
The key decision is how you want the output to behave in the workbook. If you need downstream Excel formulas to reference the result, output values are usually the best choice. If you want a visual check of the data distribution, a chart might be better. If you need a quick diagnostic, a scalar value is enough.
Here is the safest way to choose the output:
- Use values when the result should power charts or formulas.
- Use tables when the result needs to stay readable.
- Use charts when the audience wants a visual summary.
That flexibility is one of the biggest reasons Python in Excel is useful in real business workflows.
When should you use Python instead of formulas?
Use Python in Excel when logic is easier to express in code than in cells. Python suits data wrangling, grouped summaries, statistical checks, and reusable transformations. Build a small library of Python in Excel formulas for recurring transformations, while ordinary Excel formulas remain clearer for arithmetic, quick lookups, and row-level calculations.
Python is especially helpful when a workbook starts to look like a manual data pipeline. For example, if you are trimming text, normalizing case, removing duplicates, grouping by date, and then calculating a summary, pandas can usually do the job more cleanly than a long set of helper columns.
On the other hand, a plain formula is still the right answer when the task is simple and local. SUM, AVERAGE, XLOOKUP, and similar functions are faster to read for everyday calculations. The point is not to replace every formula with Python; the point is to use the tool that makes the workbook easier to maintain.
If you need help drafting, explaining, or debugging ordinary worksheet formulas before you move to code, see our guide on how to use ChatGPT with Excel.
A good rule of thumb is this: if another analyst can understand the calculation at a glance, keep it in formulas. If they need to trace several transformation steps, move the logic into Python.
What are the current limitations?
The biggest limitation is platform support. Microsoft currently says Python in Excel is available on Windows, the web, and Mac, but not on iPad, iPhone, or Android. It also requires internet access because the calculations run in the Microsoft Cloud. That means offline work or mobile review is not the ideal environment for live Python cells.
There is also a practical planning limit: you do not control the local Python installation the way you would on your own machine. Microsoft says local customizations do not affect Python in Excel calculations, so you should expect a standardized environment instead of a fully custom notebook runtime.
The add-on licensing model is another consideration: premium compute and calculation-mode options mean the exact feature set depends on your plan.
For most people, the workaround is simple: keep the workbook logic compatible with the supported cloud runtime, and treat Python in Excel as a managed analytics layer rather than an open-ended local environment.
FAQ
Python in Excel combines workbook data with cloud-run Python, pandas, and charting libraries, so the answers below clarify how the managed runtime differs from local Python. They also explain installation, DataFrame analysis, visual output, and the limits analysts should expect.
Is Python in Excel the same as regular Python?
Not exactly. Python in Excel uses the Python language, but it runs inside Microsoft’s cloud-backed Excel experience rather than your local interpreter. That means the syntax feels familiar, but the runtime, library set, and output rules are managed by Excel.
Do I need to install Python on my computer?
No. Microsoft says you do not need a local Python install to use Python in Excel. The calculations run in the Microsoft Cloud, so the feature is designed to work without setting up your own interpreter, environment variables, or package manager.
Can I use pandas with Python in Excel?
Yes. pandas is one of the most natural fits for Python in Excel because it handles tables, summaries, and reshaping cleanly. If your workbook work involves grouping, cleaning, or summarizing rows, pandas is usually the first library to reach for.
Can I create charts with Python in Excel?
Yes. Microsoft says Python in Excel supports plotting with libraries such as seaborn and Matplotlib. That makes it possible to create visual summaries inside the workbook instead of exporting data to a separate notebook just to make a chart.
Why does Python in Excel sometimes behave differently from local Python?
Because the runtime is standardized. Microsoft says the calculations run in the cloud and that local customizations are not reflected in Python in Excel. If something works in your local environment but not in Excel, the difference is usually the managed runtime, not your code.
Sources and further reading
The sources below document the Python in Excel runtime, platform availability, DataFrame handling, chart support, and the broader Python adoption context. Use them to confirm the workbook behavior described in this guide, especially when Microsoft updates licensing, supported platforms, calculation modes, or library availability.
- Introduction to Python in Excel
- Get started with Python in Excel
- Python in Excel DataFrames
- Create plots and charts with Python in Excel
- Python in Excel availability
- Stack Overflow 2025 Developer Survey: Technology
The practical takeaway is simple: Python in Excel is best when Excel alone starts to feel cramped, but you still want to stay in the workbook. For clean, repeatable analysis, it gives you pandas, plotting, and cloud execution without forcing the reader out of Excel.
