
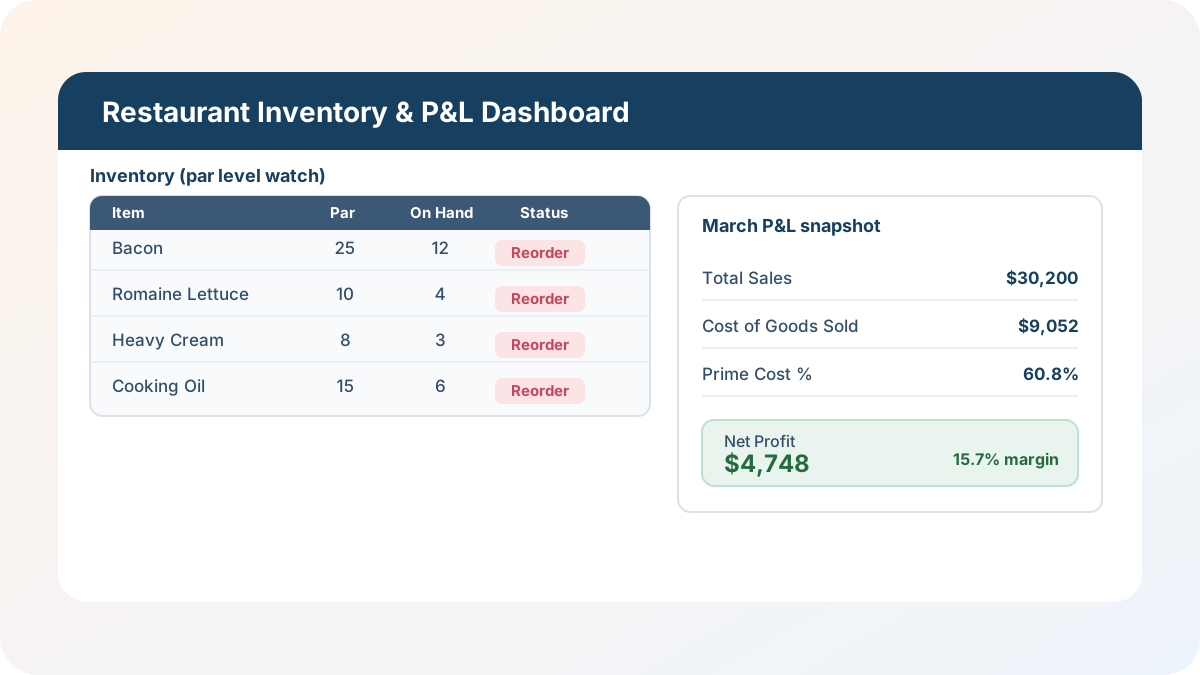
I’ve built inventory counts for a lot of small restaurants over the years, and the pattern is always the same: someone is doing a physical count on a clipboard, someone else is retyping it into a spreadsheet that doesn’t talk to the P&L, and by the time food cost percentage shows up in a report, the month that mattered is already over. This restaurant inventory spreadsheet is my answer to that — one workbook where par levels flag what to reorder, usage and waste roll up into cost of goods sold automatically, and that cost of goods sold feeds straight into a restaurant profit and loss template with prime cost and net profit already calculated.
Download the restaurant inventory spreadsheet — it’s a plain .xlsx, no macros, no external data connections, and no sign-up. Open it in Excel or Google Sheets and start replacing the sample numbers with your own.
Who is this template for?
I built this for a single-location restaurant, café, or bar that’s still running inventory and its P&L as two disconnected files — a count sheet that nobody trusts and a profit-and-loss statement that arrives too late to change anything. If you can count what’s on your shelves and log what you sold and wasted, you can drop those numbers into this workbook and watch cost of goods sold, prime cost, and net profit update without a second spreadsheet. It’s also a solid teaching example if you want to see IF-driven reorder flags, cross-sheet INDEX/MATCH lookups, and a month selector working together in one connected model.
What’s in the workbook, sheet by sheet
The workbook ships with five sheets, in this exact order, because each one depends on the sheet before it:
- Instructions — a short setup guide plus a clean-room disclosure: every formula, layout, and sample figure in this workbook was authored from scratch for Excel.TV. No vendor template, workbook, or dataset was downloaded, inspected, or adapted to build it.
- Inventory — the master list of 17 sample items (code, name, category, unit, par level, on-hand count, unit cost). This is also where the reorder flag lives, so it doubles as your current-stock snapshot.
- Usage & COGS — this month’s item-level detail: how much of each item you started with, purchased, and have left, plus how much you wasted. Usage and cost calculate automatically.
- Restaurant P&L — a three-month income statement: sales, cost of goods sold, labor, prime cost, operating expenses, and net profit.
- Dashboard — the one-page summary: a month selector for the P&L, a reorder count and total inventory value, this month’s waste cost, and a ranking of the three items costing you the most in waste.
The required inputs are the item list and par levels on Inventory, this month’s beginning counts, purchases, and waste on Usage & COGS, and sales, labor, and operating expenses on Restaurant P&L. The main outputs are the reorder count, cost of goods sold, food cost percentage, prime cost percentage, and net profit — all of which recalculate the instant you change an input cell or flip the Dashboard’s month selector.
How do I set up the restaurant inventory tracker?
- Open Inventory and replace the sample item list with your own — keep each Item Code unique, since every lookup in the workbook keys off it. Set a realistic Par Level for each item; that’s the threshold the reorder flag compares against.
- Count your current stock and enter it as On-Hand Count. Watch the Reorder Flag and Status columns update immediately for any item that’s fallen below par.
- Open Usage & COGS and enter each item’s Beginning Count and Purchases for the current month. Don’t type into Item Name or Ending Count — those pull from Inventory automatically, so your closing stock always matches what you counted.
- Log Waste (spoilage, over-portioning, comps) by item as you go. That’s what feeds the waste-cost and waste-percentage columns.
- Open Restaurant P&L and enter sales, labor, and operating expenses for each month. Cost of Goods Sold for the current month pulls automatically from Usage & COGS; prior months stay as typed-in totals.
Because Item Name and Ending Count on Usage & COGS are INDEX/MATCH formulas rather than typed text, a mismatched item code on that sheet shows up immediately as “(unknown item)” instead of silently overstating or understating usage.
How par levels and the reorder flag actually work
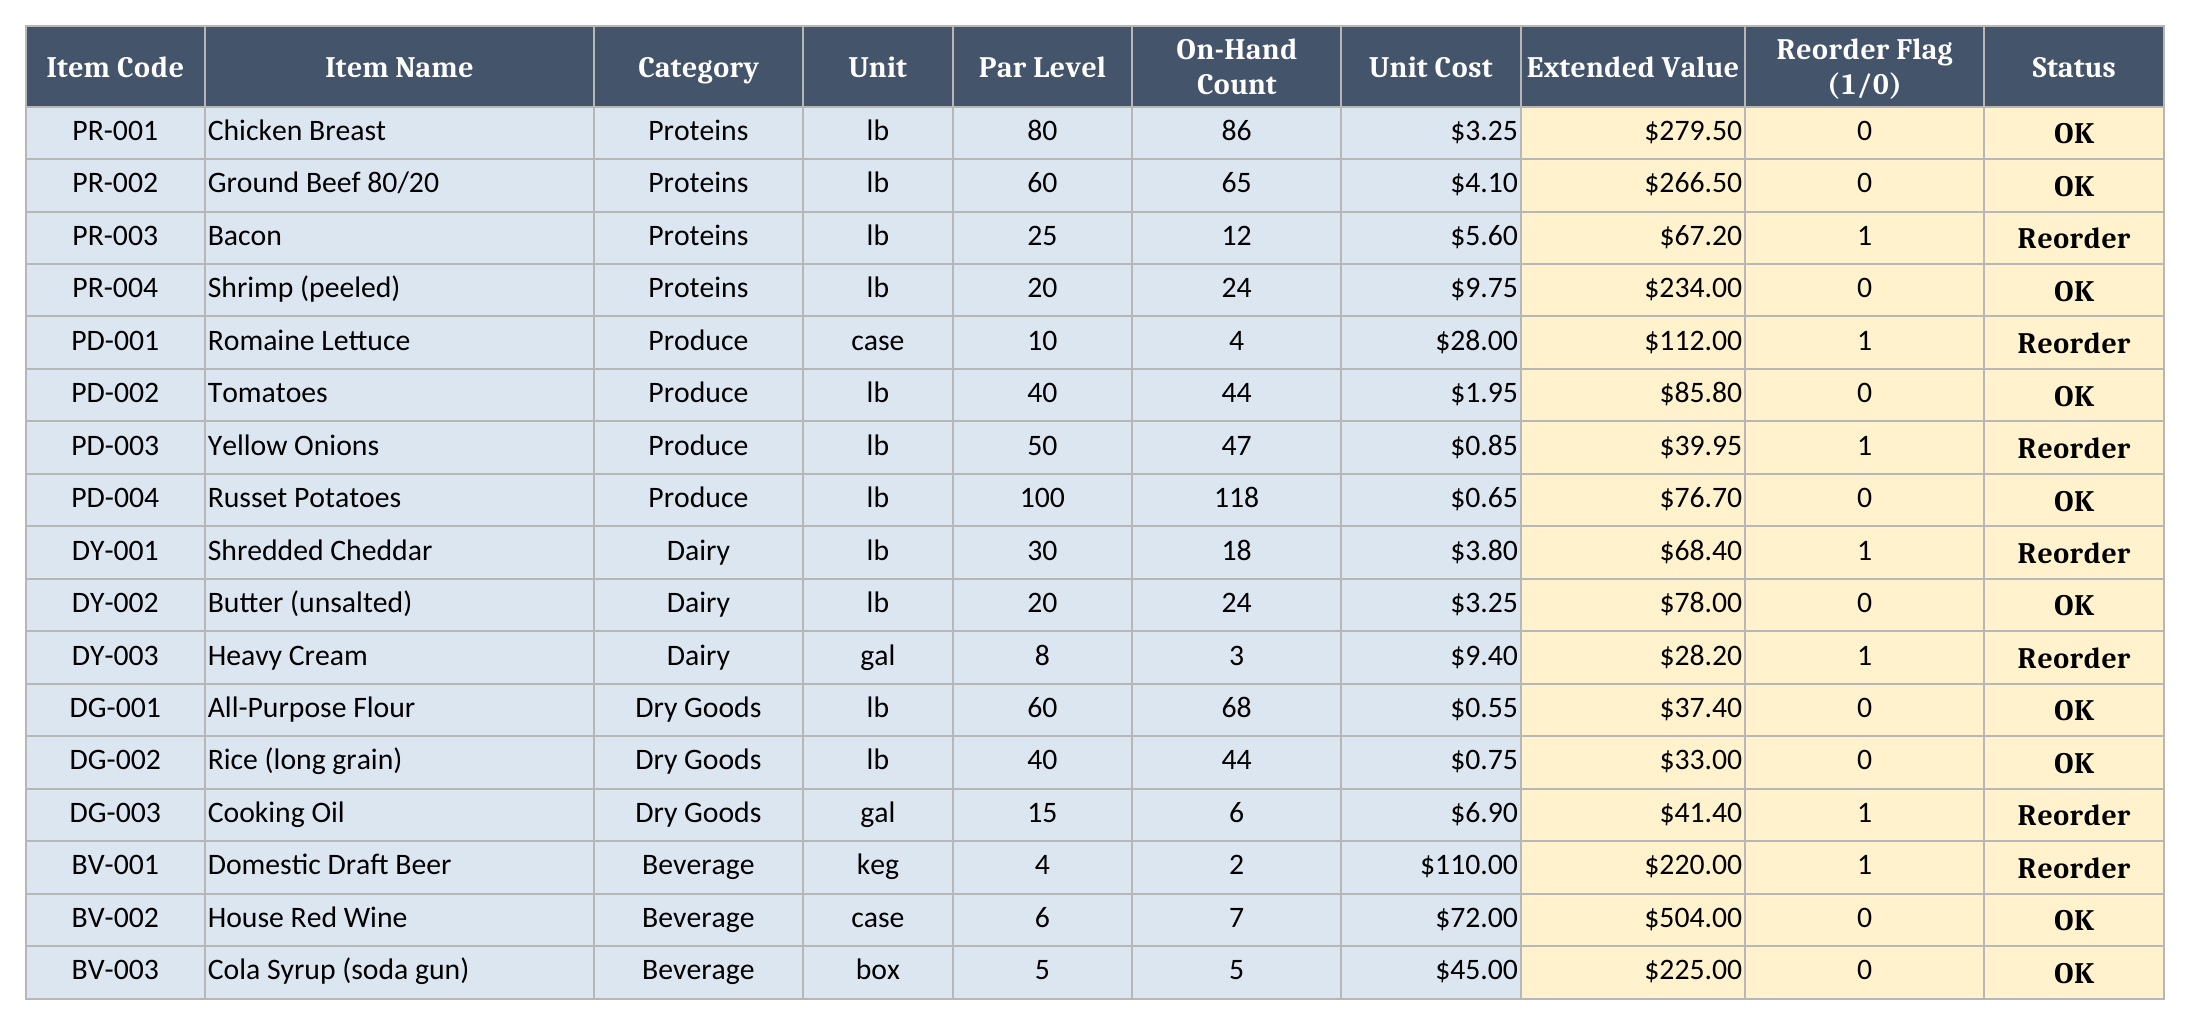
Inventory is where I spend the most time explaining this template to people, because the mechanism is deliberately simple: =IF(On-Hand Count < Par Level, 1, 0). No safety stock buffer, no lead-time math — just “are you below the line you set.” Looking at the screenshot above, seven items are flagged: Bacon, Romaine Lettuce, Yellow Onions, Shredded Cheddar, Heavy Cream, Cooking Oil, and Domestic Draft Beer. Heavy Cream is the tightest call in the list — three gallons on hand against a par of eight — which is exactly the kind of gap a manual count sheet buries in a column of numbers instead of surfacing.
That same flag column is what feeds the Dashboard’s reorder count, and it’s also the reason I built Extended Value (on-hand count times unit cost) right next to it — a flagged item and a high-dollar item aren’t the same kind of urgent, and having both columns side by side keeps you from over-reacting to a cheap item that’s merely low or under-reacting to an expensive one that’s merely close to par.
Worked example: closing March, with January and February for comparison
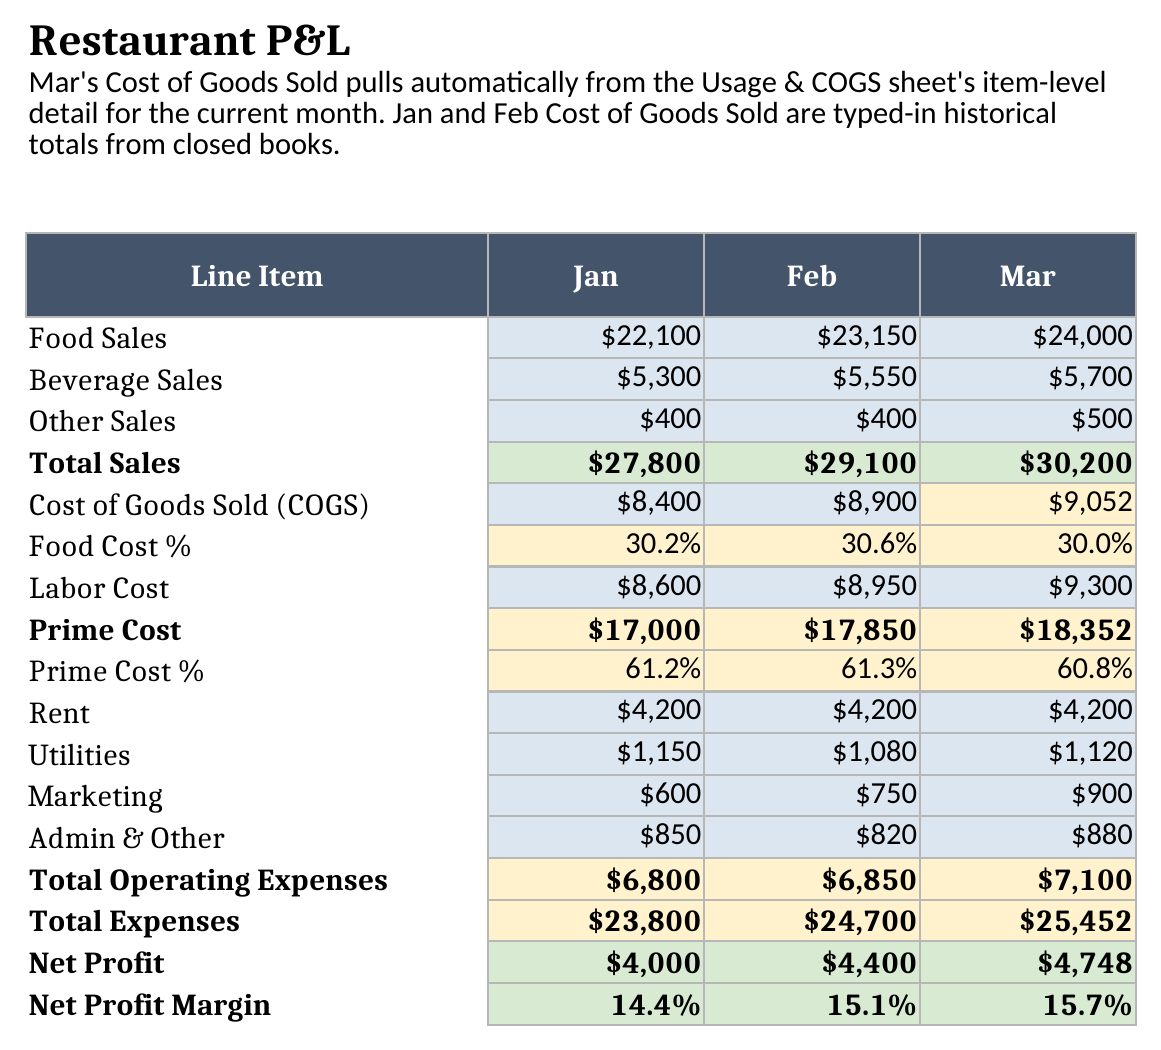
I built three months of synthetic sample data into the template so you can see this restaurant profit and loss template react to a real close cycle instead of one static snapshot. March is the “current” month — the one with full item-level usage and waste detail on Usage & COGS — while January and February sit on Restaurant P&L as closed-book historical totals, which is how most independent restaurants actually report a month that’s already behind them. Here’s what the workbook calculates for each month, pulled straight from Restaurant P&L after a full recalculation:
| Month | Total Sales | COGS | Food Cost % | Labor Cost | Prime Cost | Prime Cost % | Net Profit | Net Profit Margin |
|---|---|---|---|---|---|---|---|---|
| Jan | $27,800 | $8,400 | 30.2% | $8,600 | $17,000 | 61.2% | $4,000 | 14.4% |
| Feb | $29,100 | $8,900 | 30.6% | $8,950 | $17,850 | 61.3% | $4,400 | 15.1% |
| Mar | $30,200 | $9,051.60 | 30.0% | $9,300 | $18,351.60 | 60.8% | $4,748.40 | 15.7% |
March’s $9,051.60 in Cost of Goods Sold isn’t typed in anywhere — it’s =SUM of the Usage Cost column on Usage & COGS, item by item, across all 17 sample items. That’s the whole point of wiring the two sheets together: the food cost spreadsheet detail and the P&L total can’t drift apart, because there’s only one number, referenced twice. Prime cost lands at 60.8% of sales for March, just under the 60% target most operators aim for, and net profit margin climbs from 14.4% in January to 15.7% in March as sales grew faster than expenses.
How the dashboard ties inventory, waste, and the P&L together
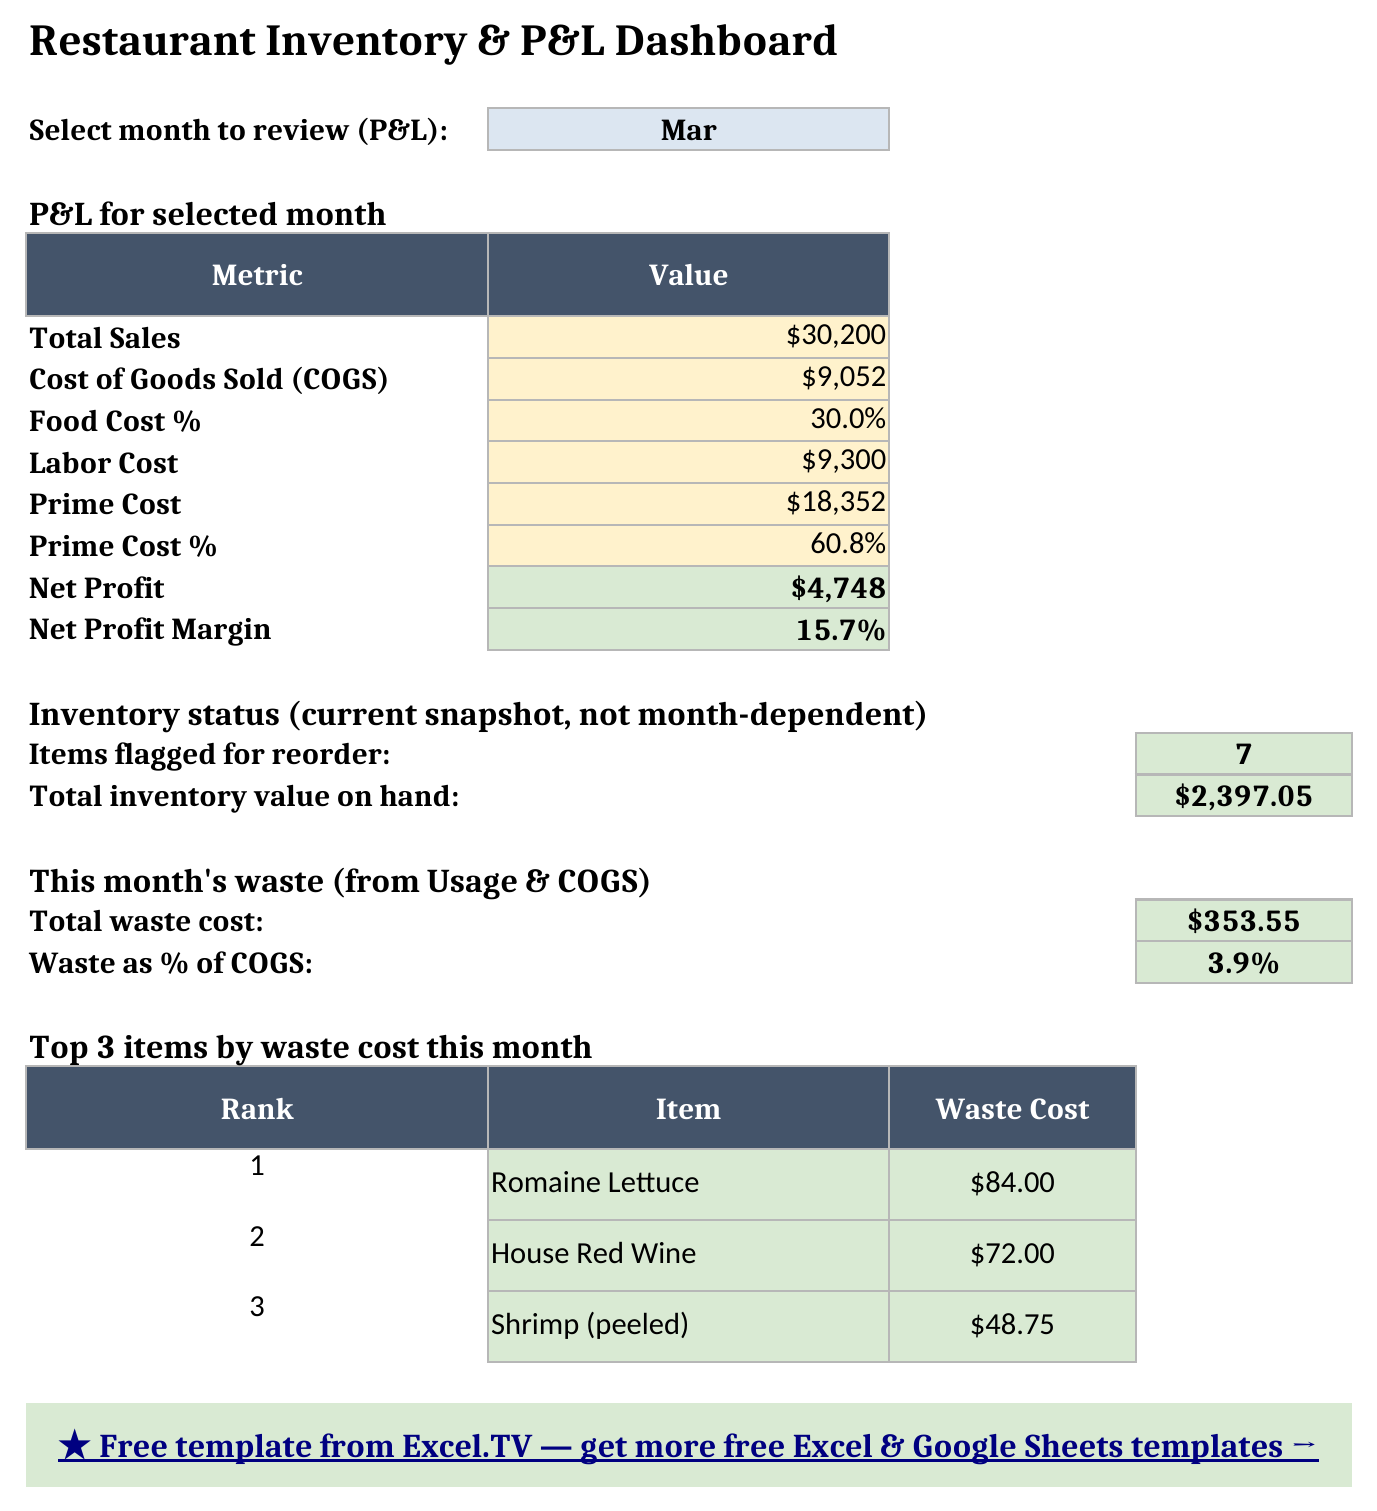
Dashboard pulls all of this into one screen. The month selector at the top drives an INDEX/MATCH lookup against Restaurant P&L’s Jan/Feb/Mar columns, so switching the dropdown to January instantly swaps every KPI — Total Sales, COGS, Food Cost %, Labor Cost, Prime Cost, Prime Cost %, Net Profit, and Net Profit Margin — to that month’s numbers. Below the P&L panel sit two sections that are deliberately not tied to the month selector: inventory status and this month’s waste. Those always reflect your current counts, because a reorder decision is about right now, not about whichever month you happen to be reviewing on the P&L.
In the sample data, seven items are flagged for reorder and the current inventory on hand is worth $2,397.05. This month’s waste comes to $353.55, which is 3.9% of Cost of Goods Sold — a number worth watching but not alarming on its own. The Top 3 ranking is where it gets actionable: Romaine Lettuce leads at $84.00 in waste cost, followed by House Red Wine at $72.00 and Shrimp at $48.75. That’s built with the same LARGE + MATCH + INDEX pattern I use across Excel.TV’s dashboard templates — it ranks the three largest waste-cost values and looks up which item produced each one.
Grab the restaurant inventory spreadsheet if you want to flip the month selector yourself, or edit an on-hand count and watch the reorder flag react immediately.
How do I use this in Google Sheets?
Google Sheets is a first-class destination for this restaurant inventory template, not an afterthought. Open Google Sheets, choose File > Import > Upload, select the downloaded .xlsx, and pick “Insert new sheet(s).” Every formula in this workbook — SUM, IF, IFERROR, INDEX, MATCH, and LARGE — is natively supported in Google Sheets, so nothing needs to be rewritten, and the category and month-selector dropdowns’ data validation carries over with it.
If you’d rather skip the download-and-import step entirely, use this one-click copy link: make a copy of the Restaurant Inventory & P&L Template in Google Sheets. Google will prompt you to save it to your own Drive, and from there it behaves identically to the Excel version — same sheets, same formulas, same month selector.
How this differs from a generic inventory or P&L template
Excel.TV also publishes generic Inventory Management and Profit and Loss Statement templates built for any business, not just food service. This template is deliberately narrower and deeper: par levels are sized in restaurant units (lb, case, gal, keg), Usage & COGS derives usage from beginning count plus purchases minus ending count instead of a generic “quantity sold” field, and Restaurant P&L uses restaurant-specific line items — food and beverage sales split out separately, prime cost as its own headline metric — instead of a general-purpose income statement layout. If your business isn’t a restaurant, the generic versions will fit better; if it is, the vocabulary and the math here should feel native from the first sheet.
Limitations to know before you rely on this
A few things are worth knowing before you put real numbers in:
- Item codes must stay in sync between Inventory and Usage & COGS. Usage & COGS looks up Item Name, Category, Unit Cost, and Ending Count from Inventory by Item Code. Insert a row in one sheet without inserting it in the other and the lookups will mismatch.
- Ending Count on Usage & COGS isn’t a free-typed number. It’s a live lookup from Inventory’s On-Hand Count, so update Inventory first — Usage and every cost figure downstream follow automatically.
- Only the current month computes Cost of Goods Sold bottom-up. January and February on Restaurant P&L are typed-in historical totals, not item-level detail. That’s intentional — it matches how most independent restaurants that don’t keep a rolling multi-month item ledger actually close a prior month — but it does mean you’ll need to re-total a closed month by hand if you ever need to revisit it at the item level.
- Ties in the top-3 waste ranking aren’t broken. The
LARGE+MATCHpattern that ranks the three costliest waste items returns the first matching item if two items tie exactly on waste cost dollars. - No macros, no external connections. Everything here is a native formula. That’s deliberate — it’s what keeps the workbook portable between Excel and Google Sheets with zero substitutions.
I’d rather flag these limitations up front than have you discover them mid-count. Once you know the item-code rule and the current-month-only COGS rule, the rest of the workbook takes care of itself.
Download the restaurant inventory spreadsheet and start replacing the sample par levels and sample month with your own — the reorder flags, the waste ranking, and the P&L will all follow.
