
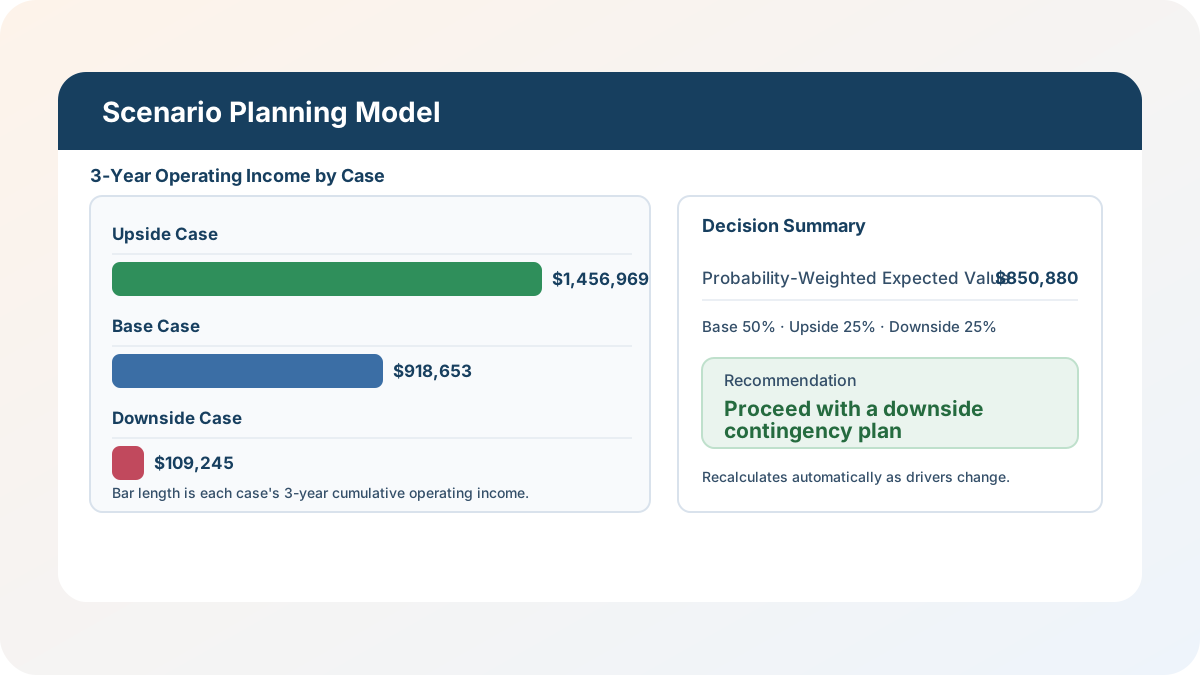
Most “scenario planning” I see in practice is one spreadsheet tab per case, built independently, that quietly drifts apart from the others the first time someone tweaks a formula in only one of them. This scenario planning template excel workbook is my answer to that: one Assumptions sheet drives Base, Upside, and Downside cases that share the exact same formula structure, a Comparison sheet lines all three up with variances, and a Decision Summary blends them into a single probability-weighted number and a recommendation — so a “what if” conversation ends with one answer instead of three disconnected tabs.
Download the scenario planning model — it’s a plain .xlsx, no macros, no external data connections, and no sign-up. Open it in Excel or Google Sheets and start replacing the sample numbers with your own.
Who is this template for?
I built this for anyone who has to make a real decision — fund a new hire, greenlight an expansion, size next year’s budget — without pretending they know exactly what next year’s revenue growth will be. If you can put a number on “this is likely,” “this is what happens if things go well,” and “this is what happens if they don’t,” you can drop those numbers into this what if analysis spreadsheet and get a comparison and a recommendation out the other end. It’s also a solid teaching example if you want to see a single Assumptions sheet driving three structurally identical output sheets, with a probability-weighted expected value tying them back together.
What’s in the workbook, sheet by sheet
The workbook ships with seven sheets, in this exact order, because each one depends on the sheet before it:
- Instructions — a short setup guide plus a clean-room disclosure: every formula, layout, and sample figure in this workbook was authored from scratch for Excel.TV. No vendor template, workbook, or dataset was downloaded, inspected, or adapted to build it.
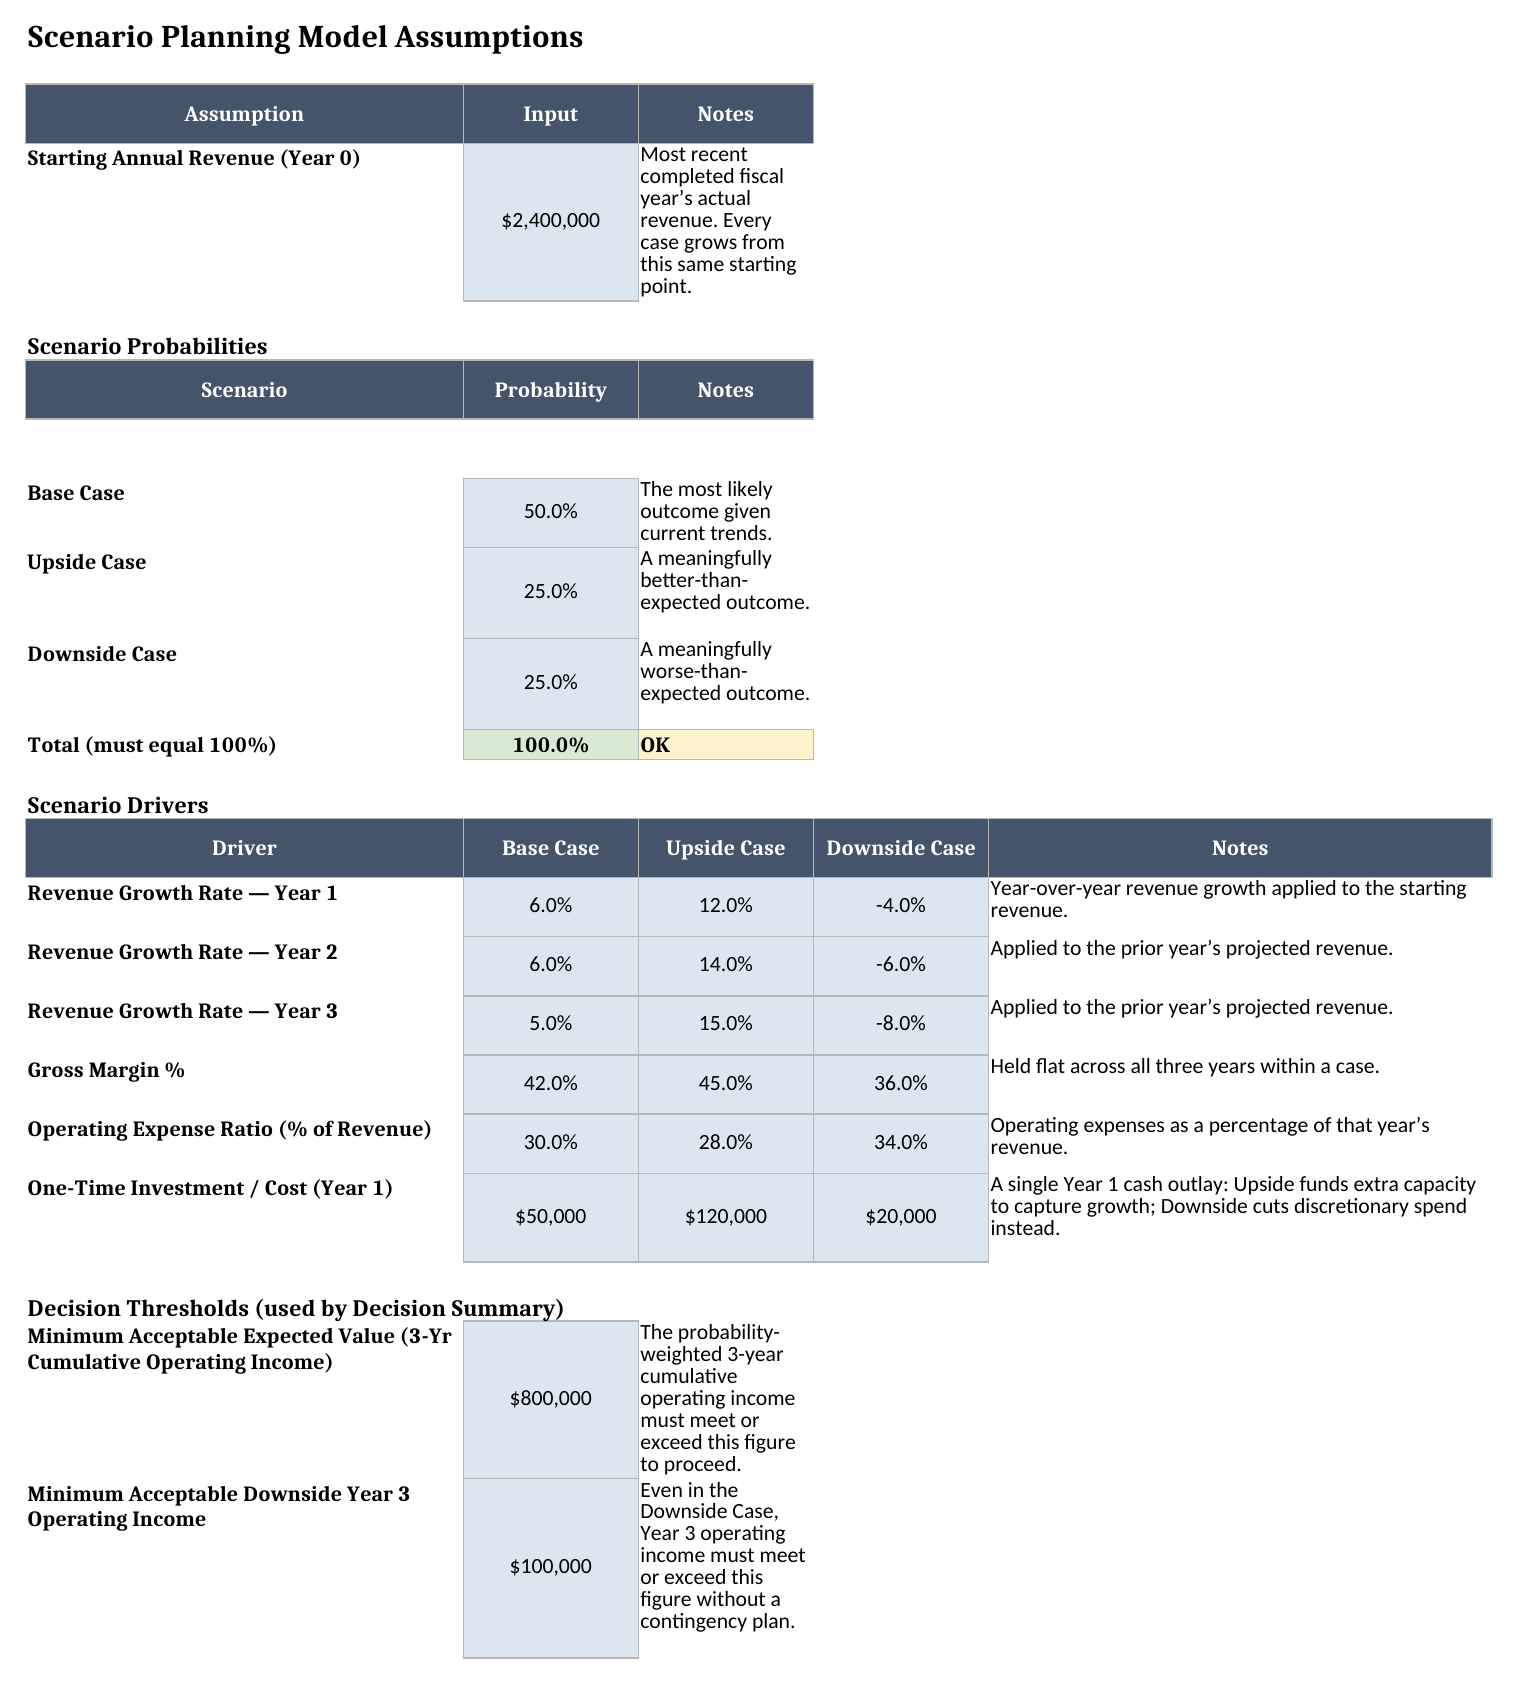
- Assumptions — the starting annual revenue, the Base/Upside/Downside probability split (validated to total exactly 100%), six per-case drivers (three years of revenue growth rate, gross margin %, operating expense ratio, and a one-time Year 1 investment or cost), and the two decision thresholds used by Decision Summary.
- Base Case — the 3-year Revenue, COGS, Gross Profit, Operating Expenses, and Operating Income projection, driven entirely by the Base Case column on Assumptions.
- Upside Case — the identical row-for-row structure as Base Case, driven by the Upside Case column instead.
- Downside Case — the identical structure again, driven by the Downside Case column.
- Comparison — all three cases’ headline outputs side by side, plus dollar and percentage variances for Upside vs Base and Downside vs Base.
- Decision Summary — a probability-weighted expected value across all three cases, a downside risk exposure check, and a Recommendation cell.
The required inputs are the starting revenue and probability split, plus each case’s growth rate, gross margin, operating expense ratio, and one-time cost on Assumptions. The main outputs are each case’s Year 3 revenue, Year 3 operating income, 3-year cumulative operating income and operating margin, the variances between cases, and the blended expected value and recommendation on Decision Summary — all of which recalculate the instant you change an input cell.
How do I set up the scenario planning model?
- Open Assumptions and replace the starting annual revenue with your own most recent full-year figure.
- Set the Base, Upside, and Downside probabilities so they total exactly 100%. Try typing 60%, 30%, and 30% — the third cell will reject it, because 120% fails the built-in check.
- Replace the growth rate, gross margin, and operating expense ratio drivers for each case with your own estimates. Keep Downside more conservative than Base and Upside more optimistic — the model doesn’t enforce an ordering, but the Comparison and Decision Summary sheets only mean what they say if the cases genuinely bracket a plausible range.
- Set the two decision thresholds: the minimum probability-weighted expected value you need to see, and the minimum Year 3 operating income you can tolerate even in the Downside Case.
- Open Base Case, Upside Case, and Downside Case to review each year’s Revenue, Gross Profit, Operating Expenses, and Operating Income — these are formula-only; edit the drivers on Assumptions instead.
How the probability validation and case formulas actually work
The mechanic I’d point to first is the data validation on the three probability cells: each one carries a custom rule requiring SUM($B$10:$B$12)=1. That’s not three separate checks — it’s the same shared condition applied to all three cells, so no matter which one you edit, Excel or Google Sheets blocks the entry the instant the three no longer total 100%. That single guardrail is what makes the probability-weighted expected value on Decision Summary trustworthy: it can never silently under- or over-weight the three cases.
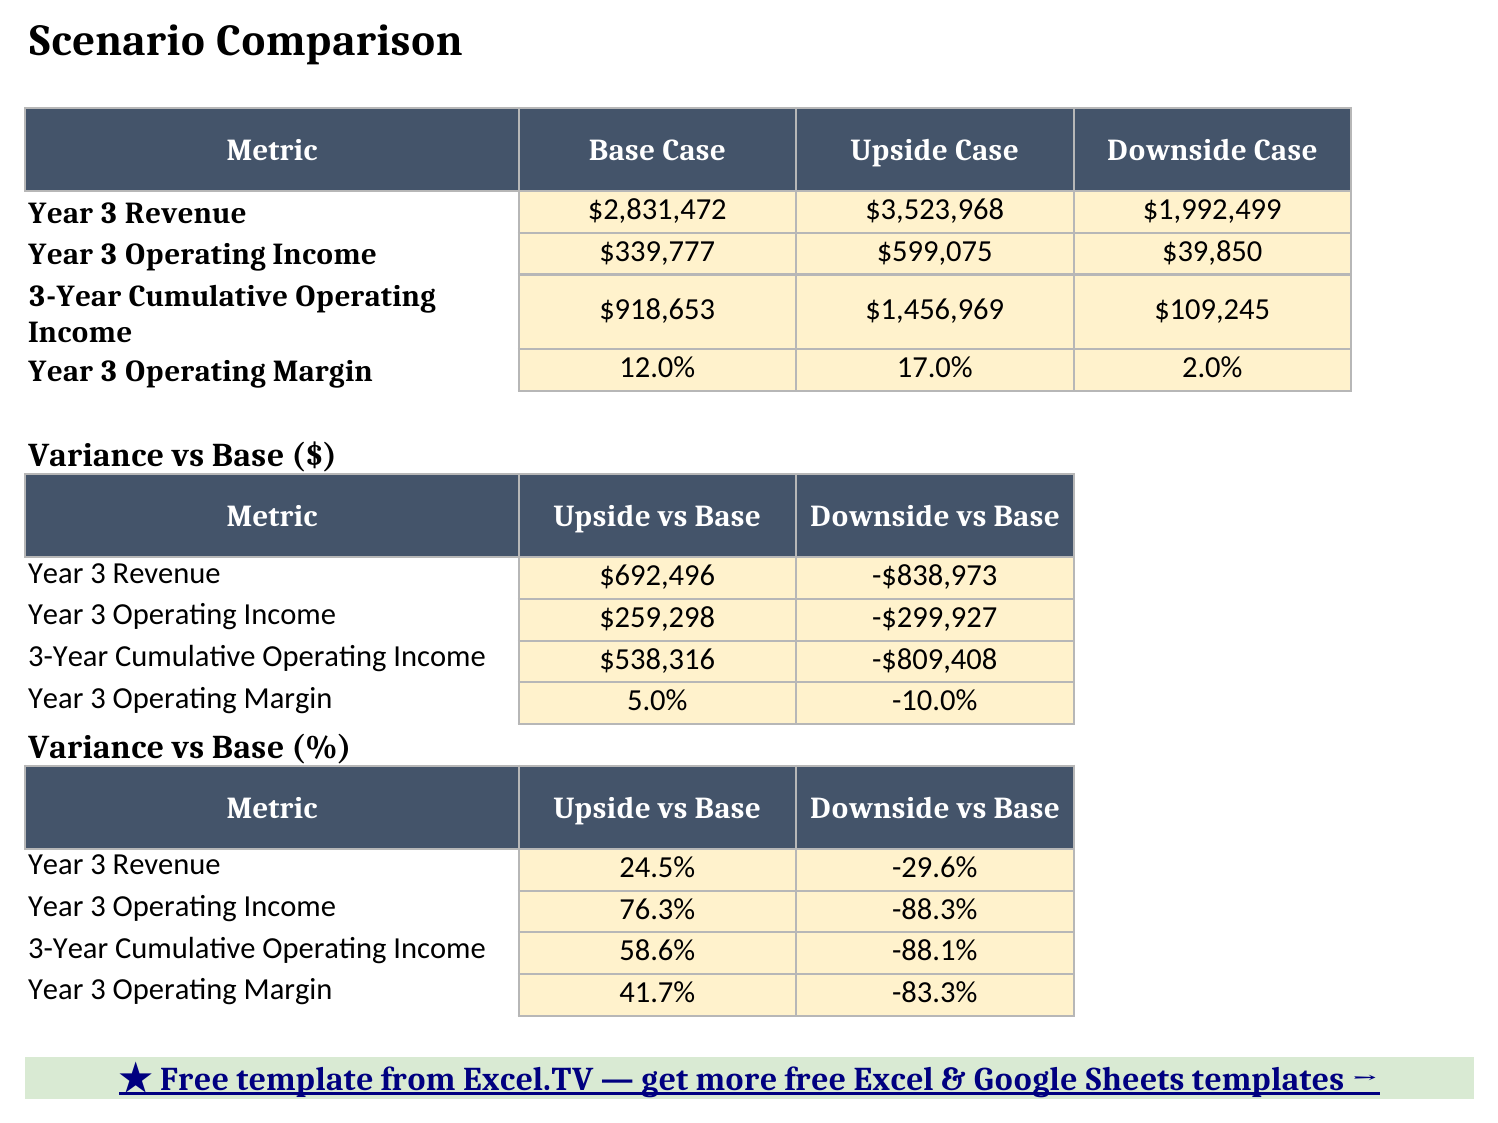
Underneath that, all three Case sheets share one formula structure and differ only in which Assumptions column they point to. Revenue compounds year over year — Year 2 Revenue is =Year 1 Revenue*(1+Year 2 Growth Rate), and Year 3 builds on Year 2 the same way — so a single growth-rate assumption change ripples through the rest of that case’s horizon automatically. Looking at the Comparison screenshot below, Downside’s Year 3 operating income comes in 88.3% below Base and Upside’s comes in 76.3% above it — that asymmetry is a direct result of Downside compounding three negative growth years on top of a lower gross margin and a higher expense ratio, while Upside compounds three strong growth years on top of a better margin and a lower expense ratio.
Worked example: three cases, one blended answer
I built one synthetic company into this template — $2,400,000 in starting annual revenue, a 50%/25%/25% Base/Upside/Downside probability split — so you can see the whole chain react to a real set of numbers instead of one static snapshot. Here’s what the workbook calculates after a full recalculation:
| Metric | Base Case | Upside Case | Downside Case |
|---|---|---|---|
| Year 3 Revenue | $2,831,472 | $3,523,968 | $1,992,499 |
| Year 3 Operating Income | $339,777 | $599,075 | $39,850 |
| 3-Year Cumulative Operating Income | $918,653 | $1,456,969 | $109,245 |
| Year 3 Operating Margin | 12.0% | 17.0% | 2.0% |
Blended with the 50%/25%/25% probability split, the probability-weighted expected value for 3-year cumulative operating income comes out to $850,880 — lower than the Base Case’s own $918,653, because the Downside Case’s weak $109,245 outcome pulls the blended figure down more than the Upside Case’s strong outcome pulls it up. That’s the whole point of weighting by probability instead of just eyeballing three numbers: a 25% chance of a bad outcome matters more to the blended answer than a 25% chance of a great one that’s only modestly larger than Base.
With a minimum acceptable expected value of $800,000 and a minimum acceptable Downside Case Year 3 operating income of $100,000, the Recommendation cell reads:
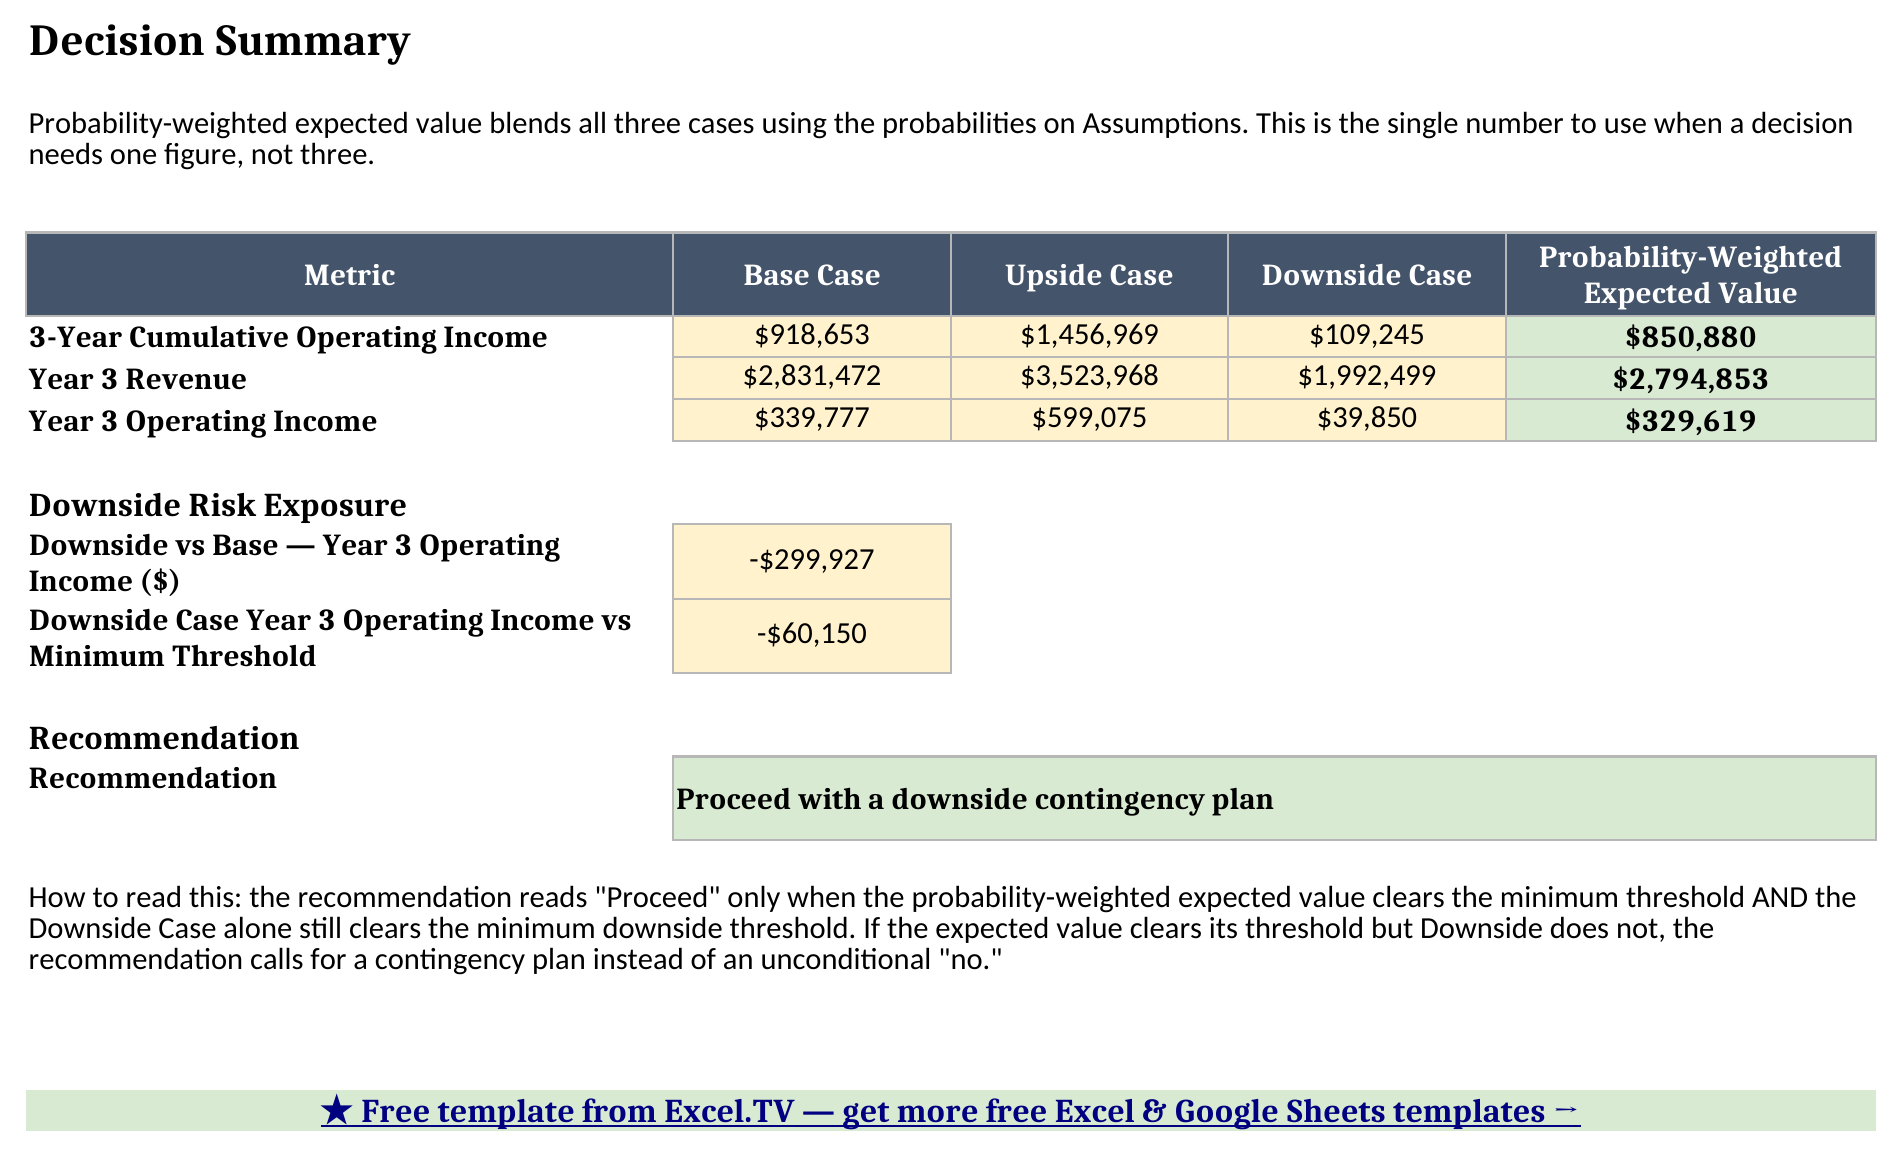
“Proceed with a downside contingency plan.” The expected value clears its $800,000 threshold, but Downside’s $39,850 Year 3 operating income falls short of the $100,000 downside threshold by $60,150 — so the formula doesn’t give an unconditional green light, and it doesn’t kill the plan either. It tells you exactly where the real risk sits: not in the average case, but in what happens if the worst case shows up.
How do I use this in Google Sheets?
Google Sheets is a first-class destination for this scenario planning template, not an afterthought. Open Google Sheets, choose File > Import > Upload, select the downloaded .xlsx, and pick “Insert new sheet(s)” or “Create new spreadsheet.” Every formula in this workbook — SUM, IF, AND, IFERROR, ABS, plus arithmetic — is natively supported in Google Sheets, so nothing needs to be rewritten, and the probability and driver data validation carries over on import too. If you try to enter 60%/30%/30% on the imported sheet, Google Sheets will reject the third cell exactly the way Excel does.
Limitations to know before you rely on this
A few things are worth knowing before you put real numbers in:
- This is a three-year operating model, not a full financial statement set. It projects Revenue, COGS, Gross Profit, Operating Expenses, and Operating Income — it does not produce a balance sheet, a cash flow statement, tax effects, or financing costs.
- Gross margin and operating expense ratio are held flat across all three years within a case. If you expect margin to improve or expenses to scale differently year by year, you’ll need to add year-specific driver cells to Assumptions and update the Case sheet formulas that currently reference one flat assumption.
- Scenario probabilities are your own judgment call, not a statistical estimate. The 100%-total validation only enforces internal consistency; it can’t tell you whether 50/25/25 is the right split for your situation.
- The recommendation is only as good as the two thresholds you set. A minimum expected value or downside floor set too low will always say “Proceed,” and one set too high will always say “Reassess” — calibrate both against what your organization can actually absorb if the Downside Case happens.
- No macros, no external connections. Everything here is a native formula. That’s deliberate — it’s what keeps the workbook portable between Excel and Google Sheets with zero substitutions.
I’d rather flag these limitations up front than have you discover them mid-decision. Once you know the flat-driver rule and the threshold-calibration rule, the rest of the workbook takes care of itself.
Download the scenario planning model and try changing one growth-rate assumption on Assumptions — watch how far it moves the expected value on Decision Summary before you decide how much confidence to put in any single scenario.
