
I built this budget vs actual template excel workbook for the reporting meeting that happens after the close, not for the pretty planning meeting that happens before the year starts. The useful question is simple: what did we say we would spend or earn, what actually happened, and which differences deserve a real conversation?
Download the budget vs actual template. It is an ungated .xlsx file with no macros, no external data connections, no Power Query dependency, and no add-ins. Open it in Excel, replace the synthetic sample data, and the variance detail, department summary, and dashboard recalculate from the month selector.
I also want to be explicit about provenance. This workbook is a clean-room build for Excel.TV. Every formula, layout choice, sample department, and sample number was written from scratch for this page. I did not download, inspect, adapt, or reproduce any vendor workbook asset to make it.
Who I built this for
This is for the small finance team, founder, controller, or department lead who has a budget in one place and actuals somewhere else. You do not need a full FP&A platform to answer the first layer of variance questions. You need a consistent line-item structure, a reliable actual-minus-budget formula, and a dashboard that points you to the biggest misses before the meeting starts.
The workbook uses six sheets in this exact order:
- Instructions — setup notes, clean-room disclosure, color legend, Google Sheets note, and limitations.
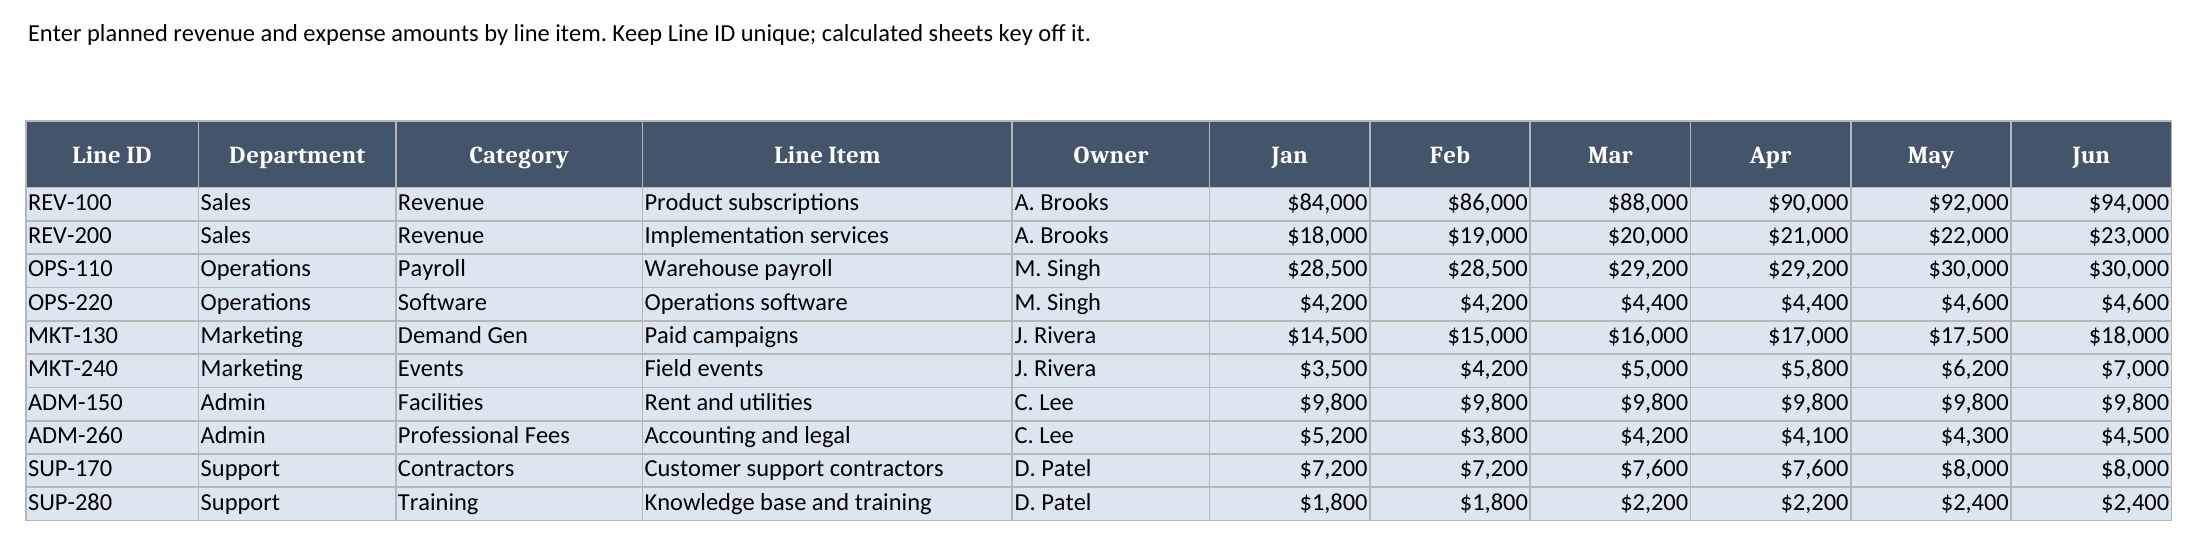
- Budget — the planned monthly amounts by line item, department, category, owner, and month.
- Actuals — the closed-period actual amounts, using the same line IDs as Budget.
- Variance Detail — the selected-month line-by-line budget variance report template.
- Department Summary — one row per department, rolled up from the variance detail.
- Dashboard — month selector, revenue and expense KPIs, net operating result, review count, and top unfavorable variance lines.
The required inputs are intentionally narrow: a unique Line ID, the department and category for each line, the budget by month, and the actual by month. The main outputs are selected-month revenue, expenses, net operating result, favorable or unfavorable variance, flagged review lines, total unfavorable variance dollars, and a department-level rollup.
The variance logic
The basic dollar variance is the part most people already know:
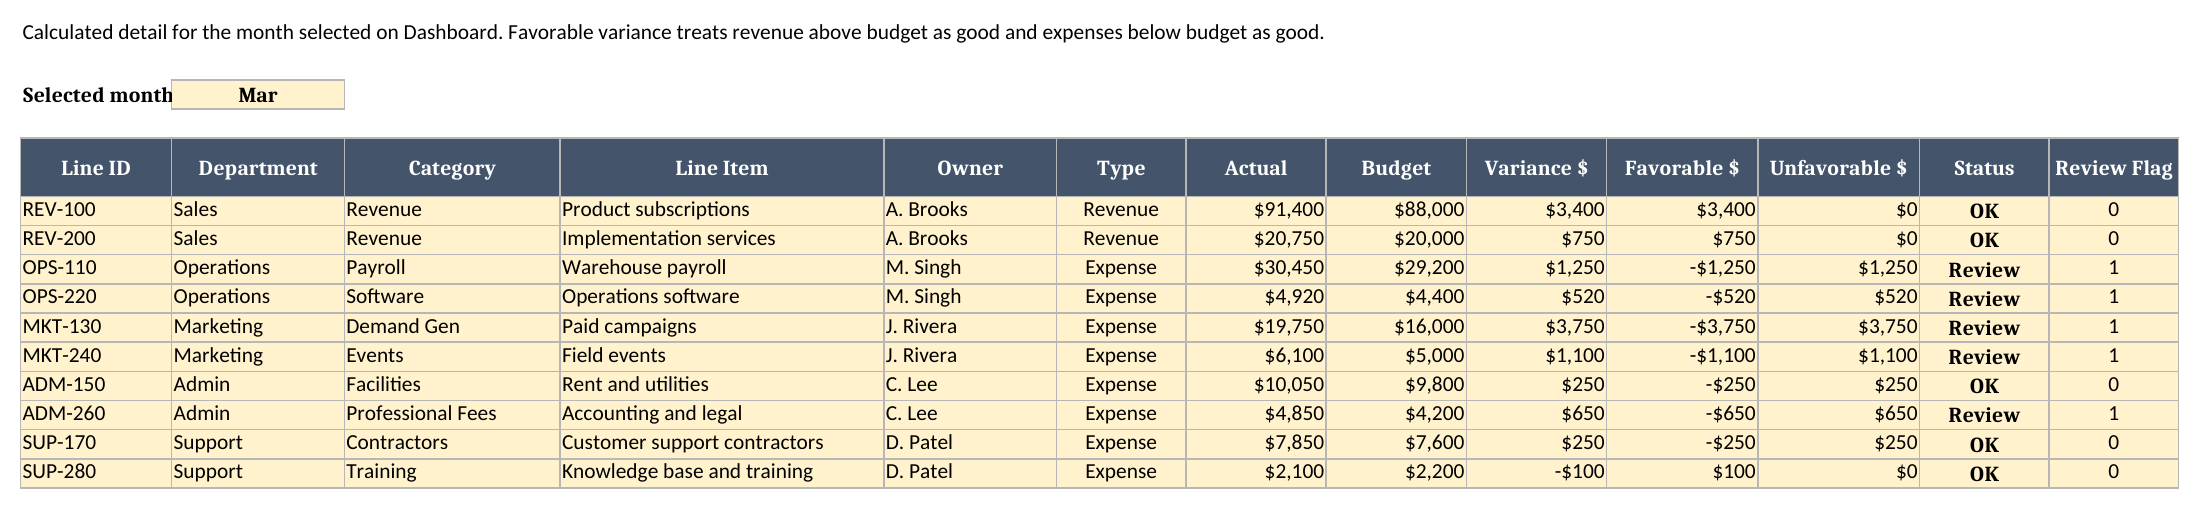
Variance $ = Actual - BudgetThat formula is correct, but it is not the whole story. A positive variance is good for revenue, because actual revenue above budget means you beat the plan. A positive variance is usually bad for expenses, because actual expense above budget means you spent more than planned. That is why the Variance Detail sheet has both Variance $ and Favorable $.
For revenue lines, favorable variance equals actual minus budget. For expense lines, favorable variance flips the sign. In plain language: revenue above plan is favorable; expenses below plan are favorable. The workbook uses a simple IF formula to make that distinction, which keeps the logic portable to Google Sheets.
I added a sample review rule too. A line is marked Review when the unfavorable variance is greater than $1,000, or when the favorable-variance logic shows the line is more than 10% unfavorable. That threshold is not a policy recommendation. It is a visible rule you can edit after you decide what materiality means for your business.
Worked example: March budget vs actual
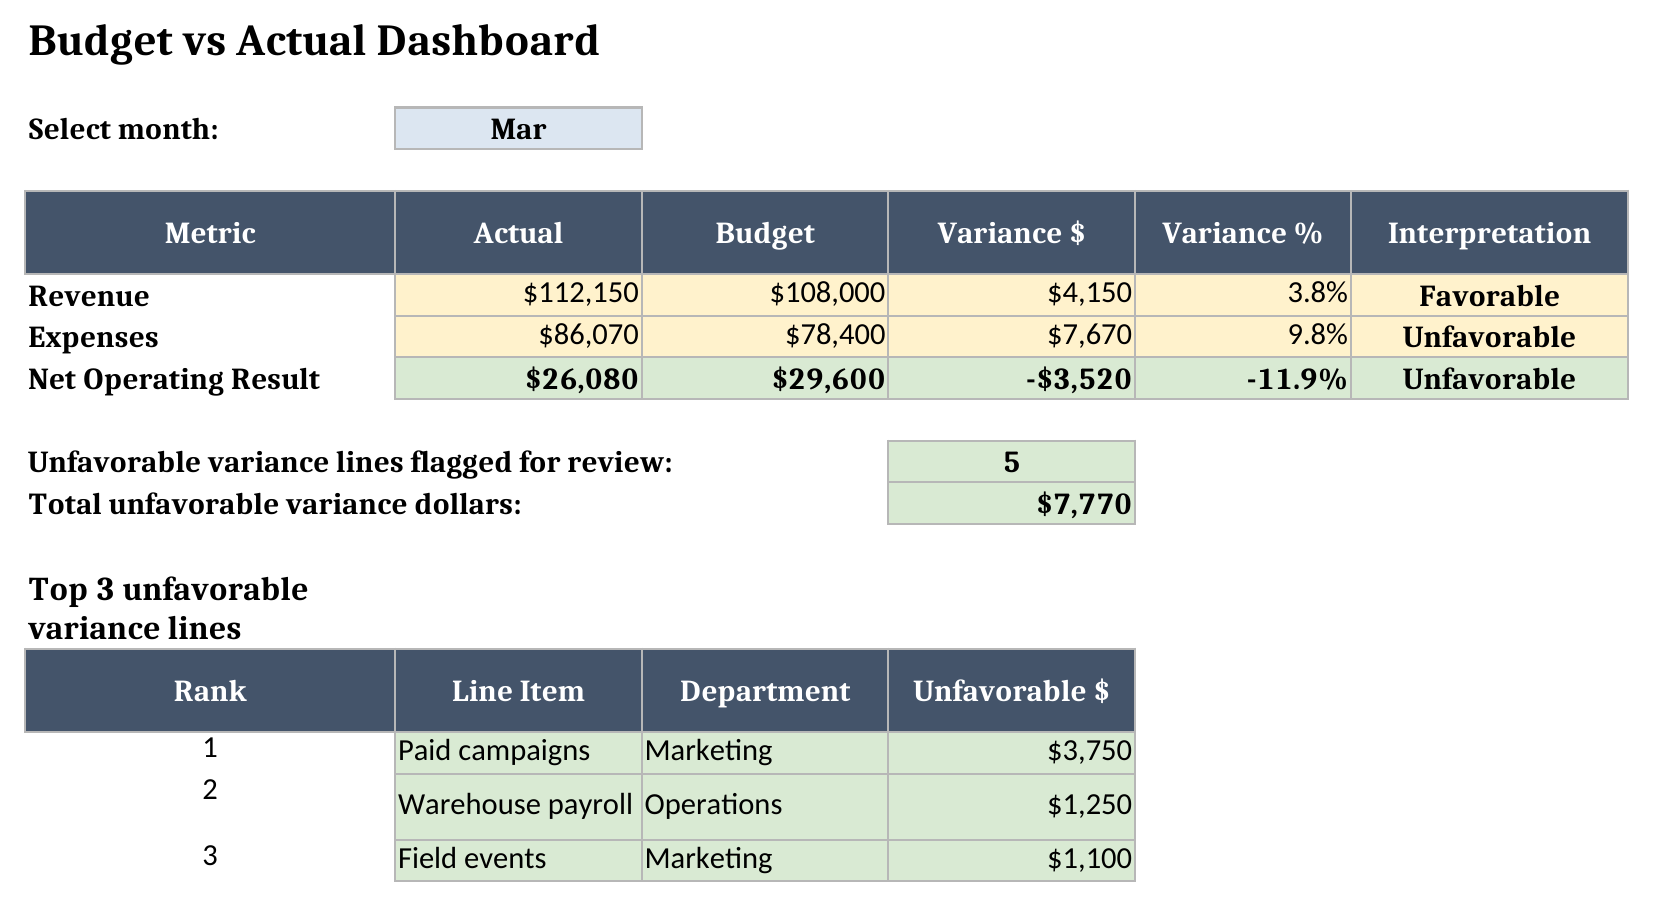
The sample workbook opens with the Dashboard month selector set to March. Here is the March story straight from the recalculated workbook:
| Metric | Actual | Budget | Variance | Interpretation |
|---|---|---|---|---|
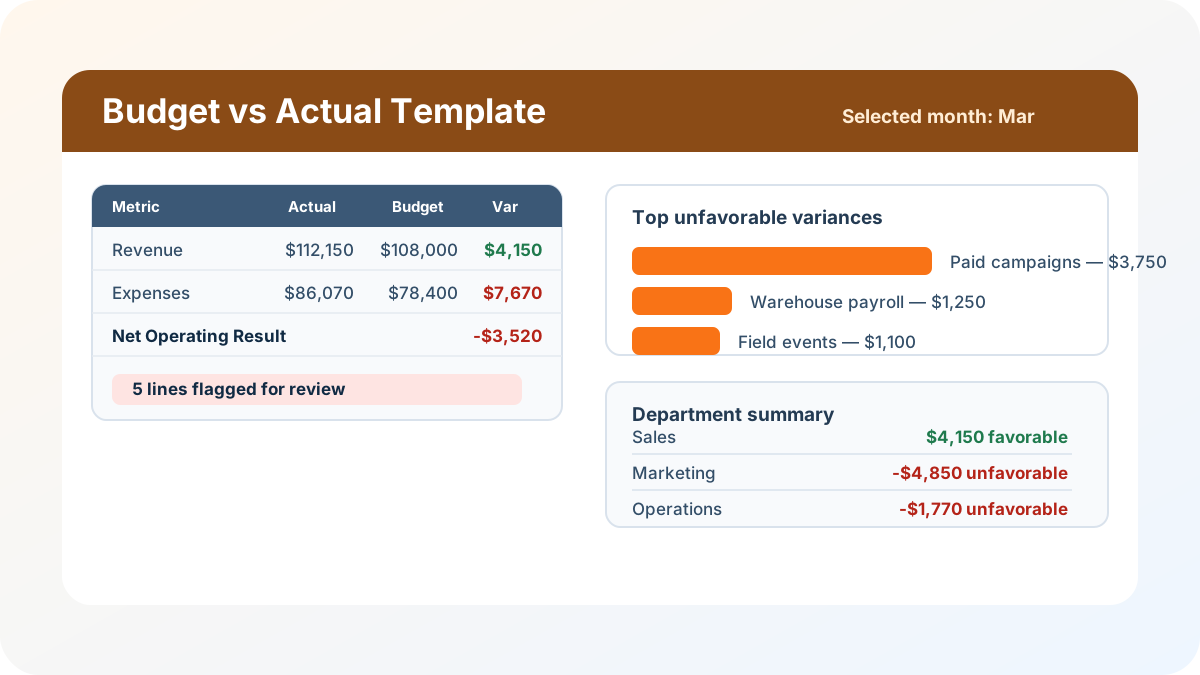
| Revenue | $112,150 | $108,000 | $4,150 | Favorable |
| Expenses | $86,070 | $78,400 | $7,670 | Unfavorable |
| Net Operating Result | $26,080 | $29,600 | -$3,520 | Unfavorable |
The revenue team beat plan by $4,150 in March. Product subscriptions were $91,400 against an $88,000 budget, and implementation services were $20,750 against a $20,000 budget. If I stopped there, I would call the month good. But the expense side moved faster than revenue.
March expenses were $86,070 against a $78,400 budget, or $7,670 over plan. The dashboard nets those two facts together: $112,150 of actual revenue minus $86,070 of actual expenses equals a $26,080 net operating result. The budgeted result was $108,000 minus $78,400, or $29,600. That leaves the month $3,520 unfavorable on the bottom line.
The top-variance list explains why. Paid campaigns in Marketing were $19,750 against a $16,000 budget, so the unfavorable variance is $3,750. Warehouse payroll was $30,450 against a $29,200 budget, for $1,250 unfavorable. Field events were $6,100 against $5,000, for $1,100 unfavorable. Those three lines alone explain $6,100 of the unfavorable expense pressure, before you even look at software or professional fees.
That is the reason I prefer a formula-first budget variance report template over a static chart. The total tells you whether the month is off. The ranking tells you where to ask the first question. In this example, my first question would not be, “Why did net operating result miss?” It would be, “What changed in paid campaigns, and was the extra spend intentional?”
How to use the workbook
Start on Budget. Replace the sample Line IDs and names with your own planning lines. Keep each Line ID unique. Choose a department from the dropdown, keep revenue lines categorized as Revenue, and use expense categories for the rest. Then enter the monthly budget values.
Move to Actuals after the month closes. The descriptive columns are formulas that look back to Budget, so you only enter the Line ID and the monthly actual values. This keeps the two input sheets aligned and makes a typo easier to spot.
Then go to Dashboard and pick the month. The dashboard feeds the selected month to Variance Detail and Department Summary. You can review the top-level answer first, then drill into the line detail.
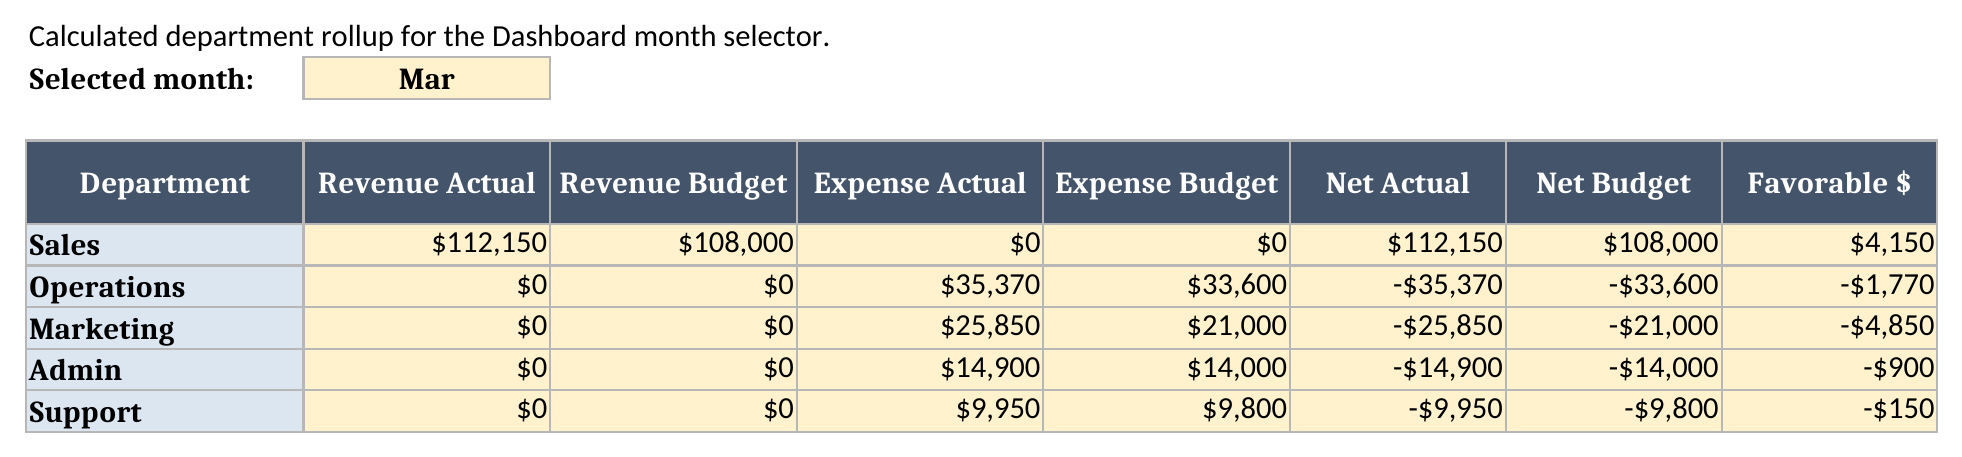
Department Summary is the sheet I would use in a management packet. It rolls the selected month into revenue actual, revenue budget, expense actual, expense budget, net actual, net budget, and favorable dollars. In March, Sales is $4,150 favorable because revenue beat plan. Marketing is $4,850 unfavorable because paid campaigns and events both came in high. Operations is $1,770 unfavorable, mostly from warehouse payroll and software.
Using it in Google Sheets
This also works as a budget vs actual google sheets template. Open Google Sheets, choose File > Import > Upload, select the downloaded .xlsx, and import it as a new spreadsheet. I kept the formulas to portable functions only: SUM, SUMIF, SUMIFS, IF, IFERROR, INDEX, MATCH, ABS, ROUND, LARGE, plus arithmetic.
If you would rather skip the import step, use this one-click copy link: make a copy of the Budget vs Actual Template in Google Sheets. Google will prompt you to save the spreadsheet to your own Drive.
I verified the imported Google Sheet through the Sheets API at the dashboard summary level. Dashboard!B6:F8 returned Revenue at $112,150 actual, $108,000 budget, $4,150 variance, 3.8%, Favorable; Expenses at $86,070 actual, $78,400 budget, $7,670 variance, 9.8%, Unfavorable; and Net Operating Result at $26,080 actual, $29,600 budget, -$3,520 variance, -11.9%, Unfavorable. That matches the March example above, so the core dashboard formulas survived the import.
After import, check the Dashboard month dropdown first. Google Sheets should preserve the data validation list. If your import settings create separate sheets instead of a new spreadsheet, move the tabs into one file so the cross-sheet formulas stay together.
Limitations before you rely on it
A few constraints are deliberate:
- The workbook includes six months and ten sample lines, not an unlimited model.
- If you add line items, add them to Budget and Actuals and extend the calculated ranges.
- The top-three ranking uses
LARGEplusMATCH, so exact ties return the first matching line. - The review threshold is a sample rule: unfavorable dollars over $1,000 or more than 10% unfavorable.
- The sample data is synthetic and not a benchmark for your industry.
- There are no macros or external connections, which is what keeps the file portable.
If you need a broader reporting package after this, the finance dashboard excel template is built around monthly close reporting. This workbook is narrower on purpose: budget, actual, variance, department rollup, and a dashboard that gets you to the next question quickly.
