
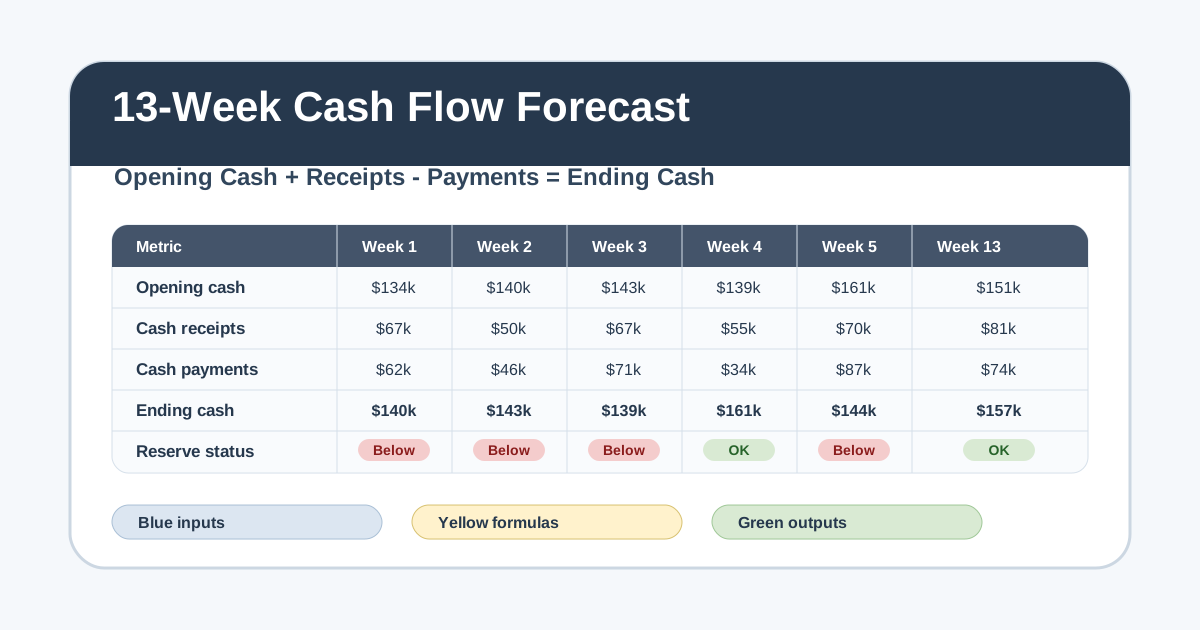
When I build a short-term cash forecast for a small business, I do not start with a 12-month income statement. I start with the bank account. What cash do we have right now? What cash is actually going to land this week? What cash is leaving for payroll, rent, suppliers, taxes, debt, and the quiet little recurring charges that never seem to miss their due date? This cash flow forecast template excel workbook is built around that question, week by week, for the next 13 weeks.
Download the cash flow forecast template — it is a plain .xlsx file, no macros, no external data connections, and no sign-up. Open it in Excel or import it into Google Sheets and replace the synthetic sample numbers with your own weekly cash timing.
I built this as a practical weekly cash flow forecast spreadsheet, not as a decorative dashboard. The workbook separates inputs from calculations, keeps the cash roll-forward visible, and flags weeks where ending cash falls below a reserve target. If you have ever had a profitable month on paper and still worried about making a Friday payroll run, this is the view I would want in front of me.
Who is this template for?
I built this for owners, operators, controllers, bookkeepers, and finance leads who need short-term liquidity visibility without buying a dedicated forecasting system. It works especially well when your cash timing is uneven: biweekly payroll, monthly rent, supplier check runs, quarterly tax payments, large invoice collections, or a few one-time receipts that make the difference between a comfortable month and a tight one.
It is also useful as a teaching workbook if you want to see a clean 13-week cash model built with simple formulas. There are no macros, no Power Query steps, no dynamic array functions, and no workbook links. The mechanics are deliberately plain: opening cash plus receipts minus payments equals ending cash. The value is not in a clever formula. The value is in forcing every receipt and payment into the week when cash actually moves.
What’s in the workbook, sheet by sheet
The workbook ships with seven sheets, in this exact order:
- Instructions — a setup guide, color legend, Google Sheets note, limitations, and a clean-room disclosure. Every formula, layout, and sample figure was authored from scratch for Excel.TV.
- Assumptions — the forecast start date, the minimum cash reserve target, and the 13 week-start dates that drive the rest of the workbook.
- Opening Cash — the starting operating cash components that roll into Week 1 opening cash.
- Receipts — expected cash inflows by source and by week. This is where customer collections, recurring receipts, one-time proceeds, and other deposits are timed.
- Payments — expected cash outflows by payee/category and by week. This is where payroll, rent, suppliers, taxes, software, debt service, and other operating payments are timed.
- 13-Week Forecast — the formula-only cash roll-forward: opening cash, receipts, payments, net cash flow, ending cash, reserve shortfall, cumulative receipts, and cumulative payments.
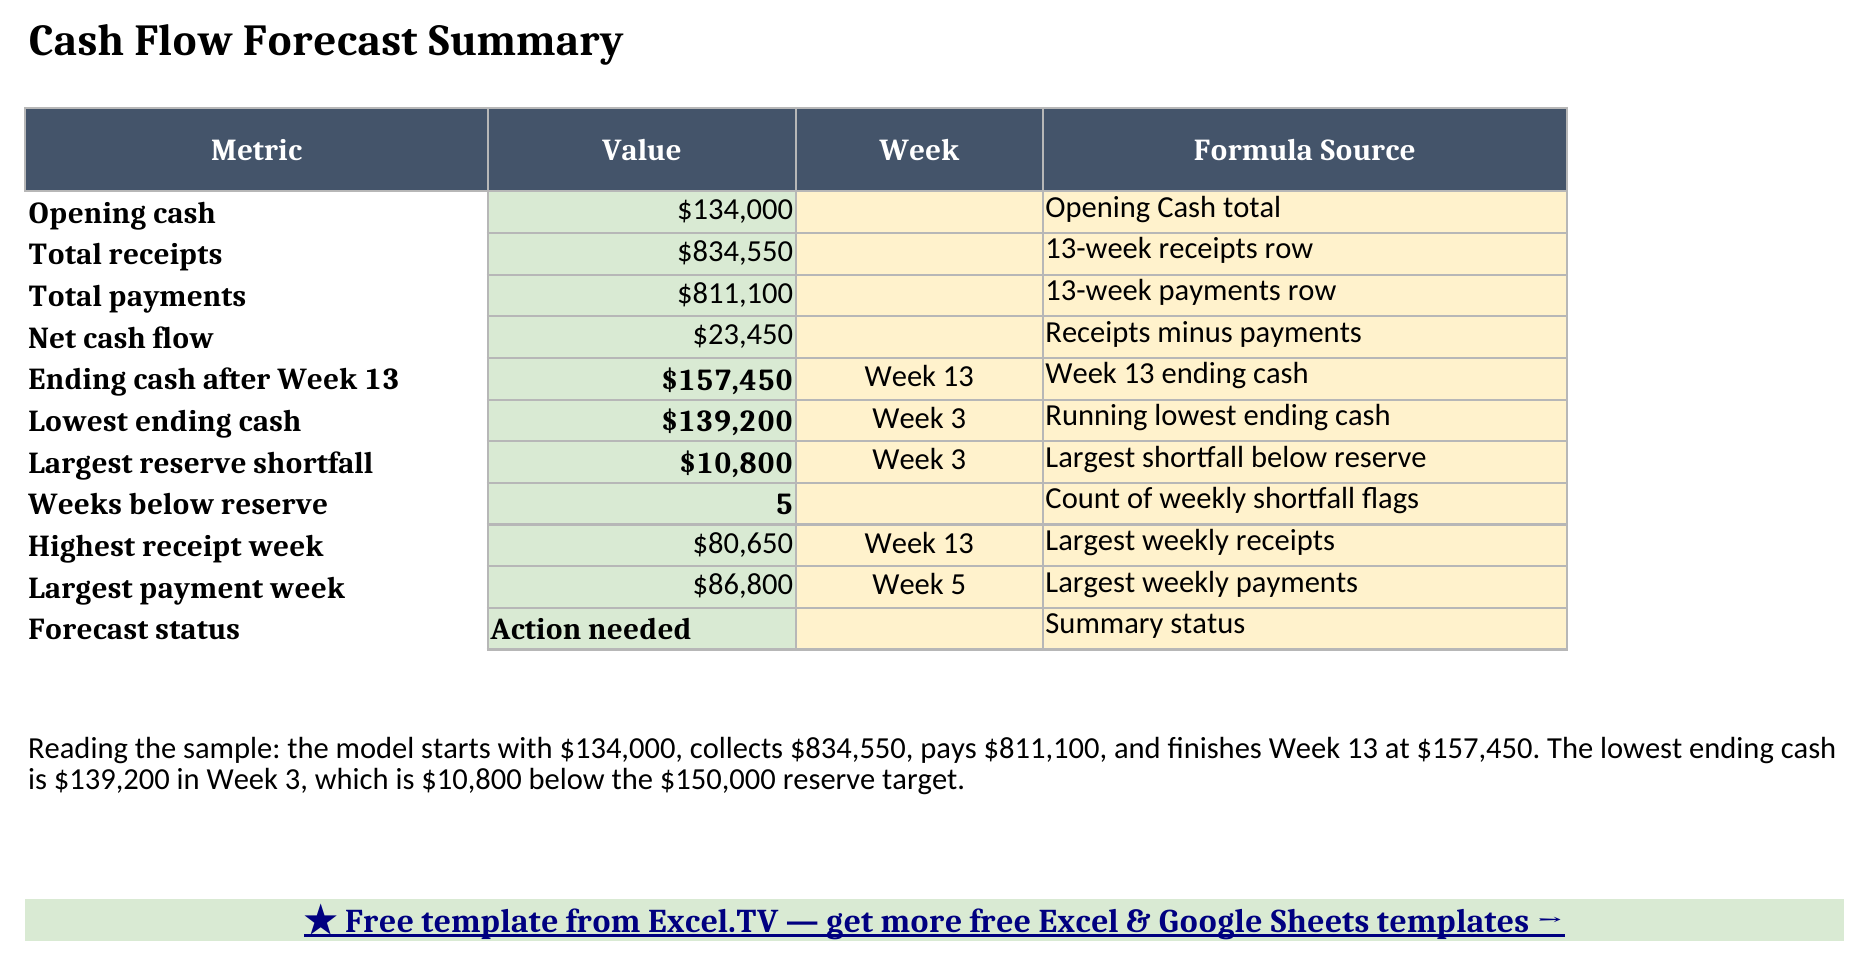
- Summary — the one-page output view with total receipts, total payments, net cash flow, ending cash, lowest ending cash, weeks below reserve, and the largest receipt/payment weeks.
The required inputs are intentionally narrow: start date, reserve target, opening cash balances, weekly receipt timing, and weekly payment timing. The main outputs are ending cash by week, reserve status by week, total 13-week receipts, total 13-week payments, net cash flow, lowest ending cash, largest reserve shortfall, and weeks below the reserve target.
How I set up the forecast
Start on Assumptions. The sample workbook begins on January 5, 2026 and uses a minimum cash reserve of $150,000. You can change both. The week-start dates across the workbook are formula-driven from that first date, so if your operating week starts on Sunday instead of Monday, change the first date and the 13-week timeline moves with it.
Then open Opening Cash and replace the sample components with your real available operating cash. I separate this into components because it prevents one common mistake: treating every balance on a bank report as cash that can be spent. The Include? (Yes/No) column controls the total with a SUMIF formula, so a row marked No stays visible for review but does not feed Week 1 opening cash. If a balance is restricted, committed, or not really available for operations, leave the row in the schedule and mark it No. If a card batch is already approved and expected to settle, mark it Yes only if that is how you manage daily cash.
Next, fill out Receipts. The important word here is cash. If you invoice a customer in Week 2 but expect payment in Week 5, put the receipt in Week 5. If a deposit usually batches nightly and settles two days later, put it in the week it lands. That timing discipline is why I prefer this format over a monthly cash flow projection when the question is short-term liquidity.
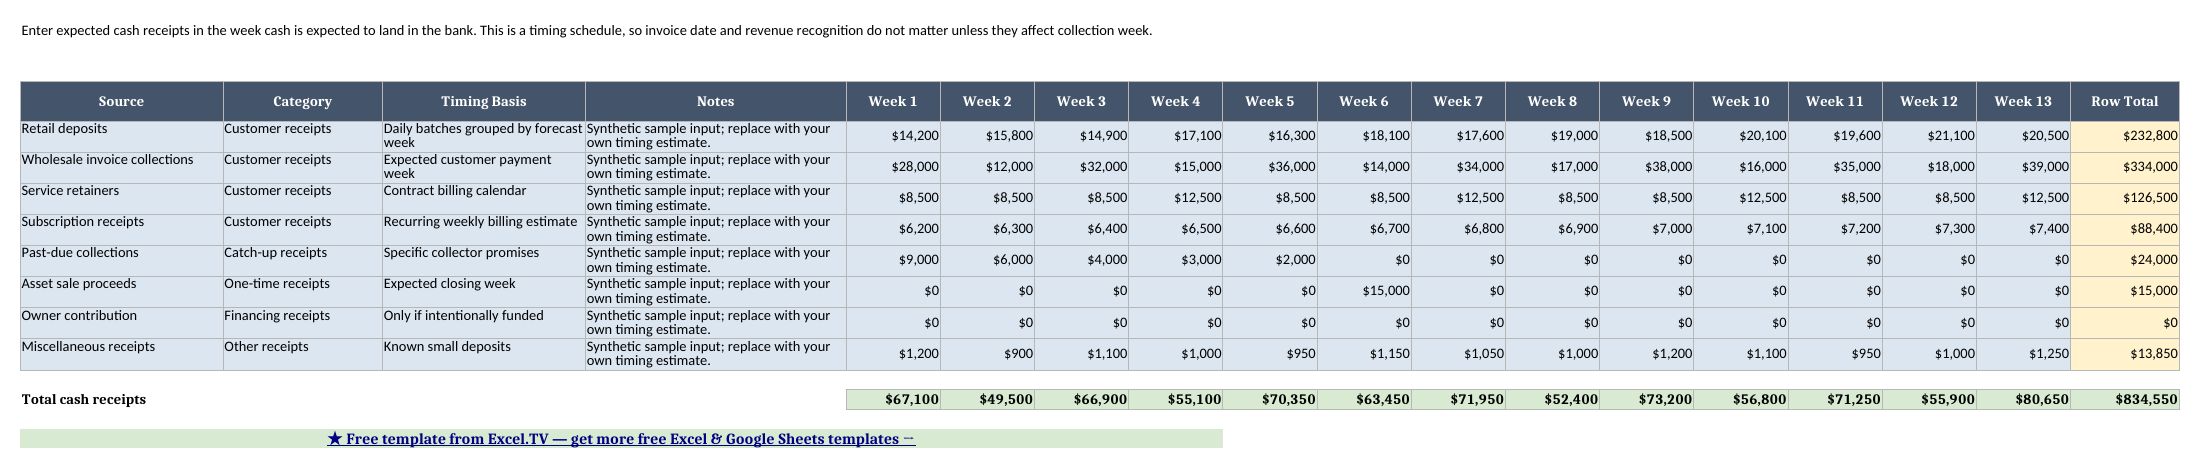
Then fill out Payments the same way. Payroll belongs in the week it clears. Rent belongs in the week it leaves. Supplier payments belong in the week you expect the check run or ACH pull to happen. I like having payroll, rent, taxes, and debt service on separate rows because those items tend to have fixed timing and real consequences if you miss them. Smaller operating payments can be grouped if the forecast gets too detailed.
How the 13-week cash roll-forward works
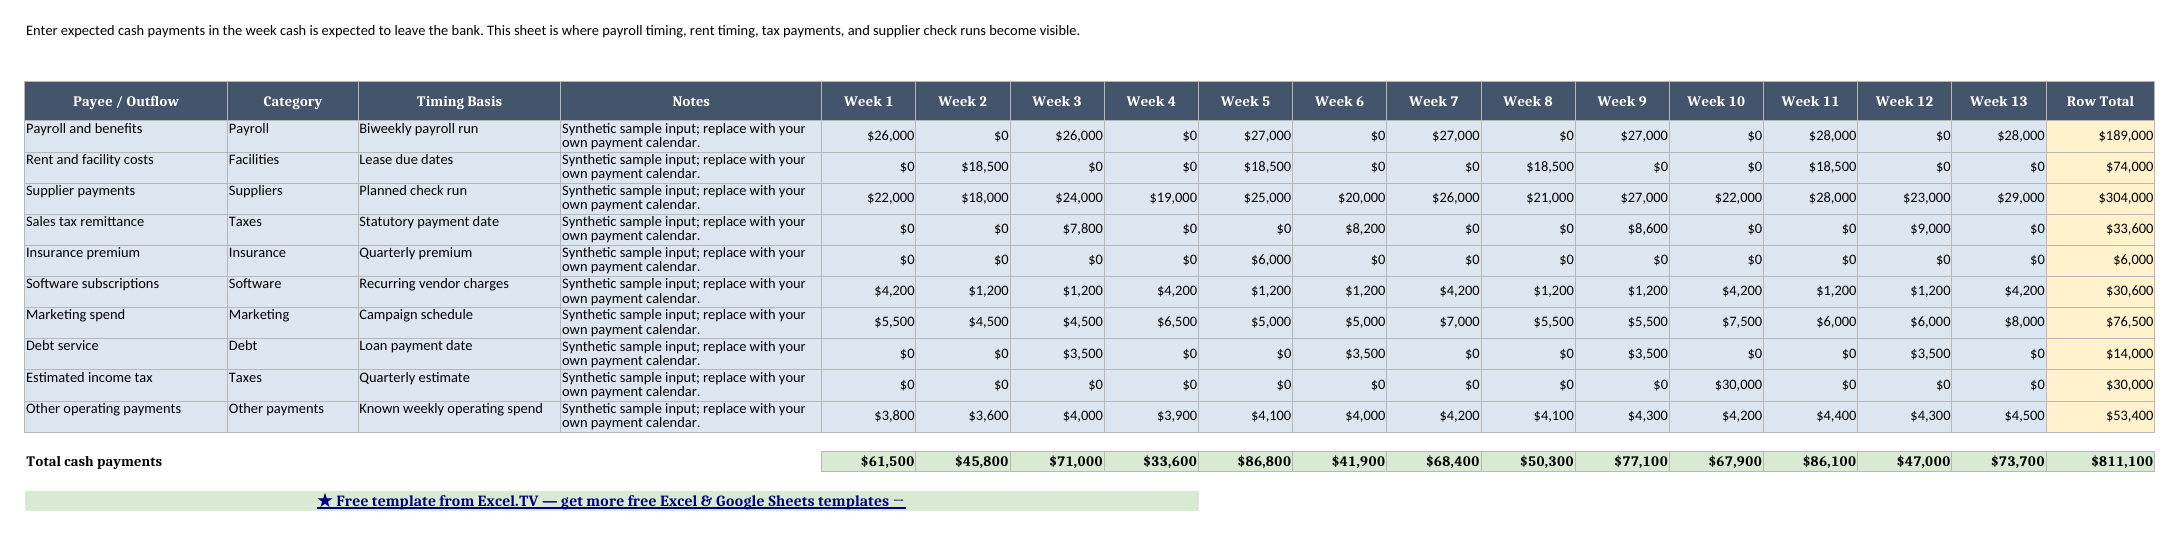
The 13-Week Forecast sheet is where the model ties together. You should not type into it. Week 1 opening cash comes from Opening Cash. Week 2 opening cash equals Week 1 ending cash. Week 3 opening cash equals Week 2 ending cash, and so on through Week 13.
Each weekly column follows the same formula pattern:
Opening Cash + Cash Receipts - Cash Payments = Ending CashThe template also calculates net cash flow, cumulative receipts, cumulative payments, surplus or shortfall versus the minimum cash reserve, and a simple status label. If ending cash is below the reserve target, the status reads “Below reserve.” If ending cash is at or above the target, it reads “OK.”
That reserve target matters because cash forecasts are not just about staying above zero. In the real world, a business may need a cushion for payroll timing, supplier terms, inventory buys, seasonality, or simply the lag between a customer promise and a customer payment. I set the sample reserve at $150,000 because it makes the early-week pressure visible even though the full 13-week period ends positively.
Worked example from the workbook
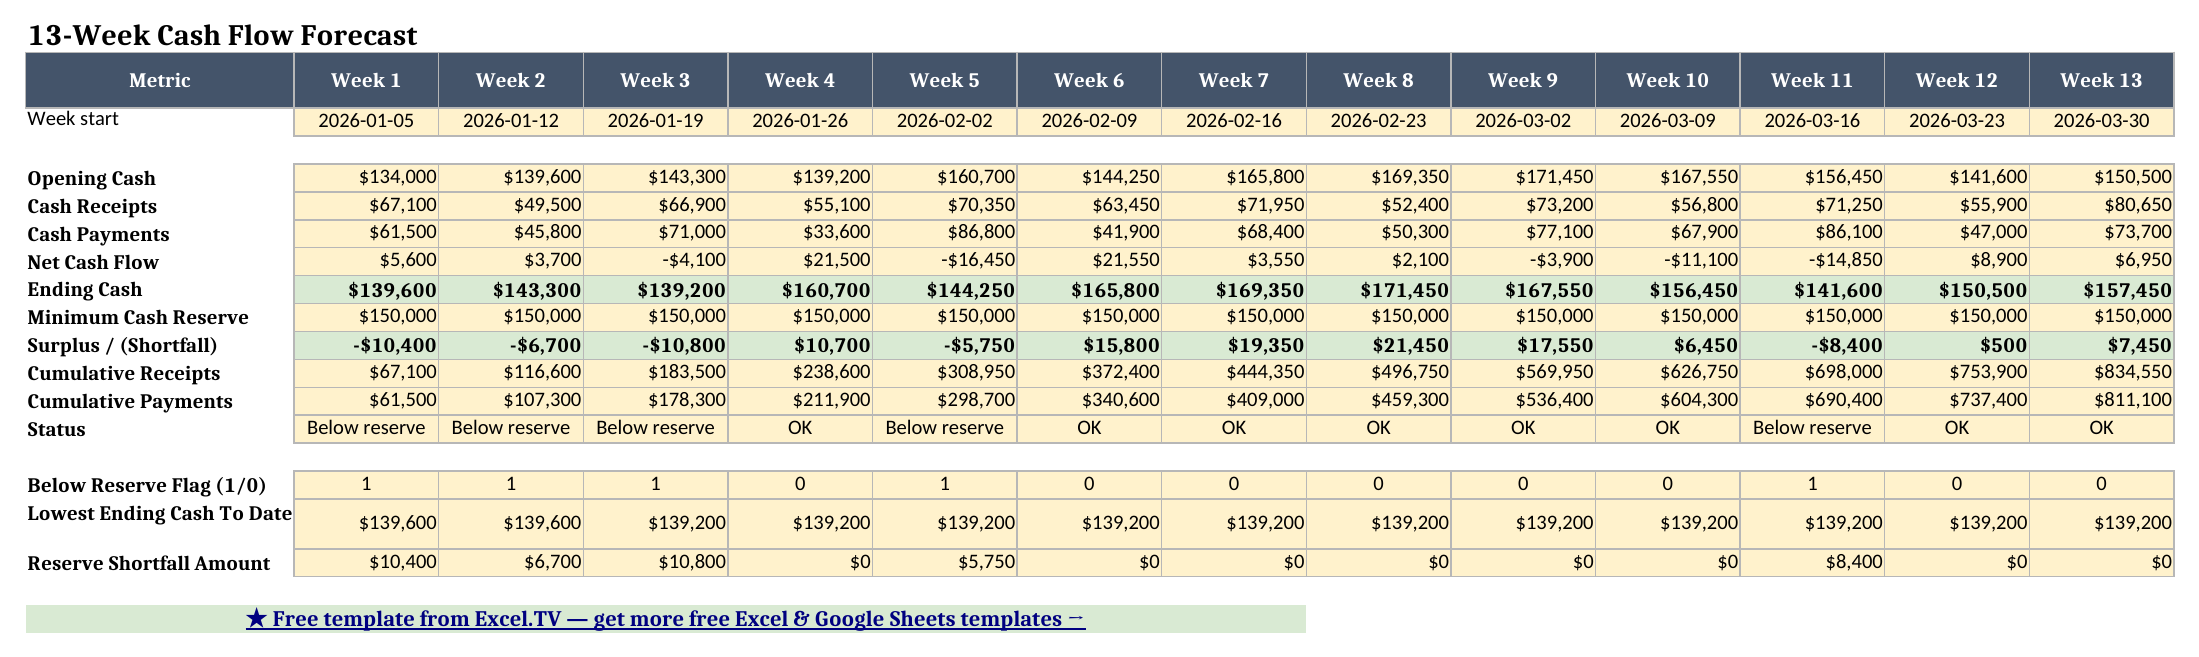
Here is the sample forecast recalculated from the workbook. The figures are synthetic, but the mechanics are the same ones I use in a real weekly cash flow forecast spreadsheet:
| Week | Cash Receipts | Cash Payments | Net Cash Flow | Ending Cash | Reserve Status |
|---|---|---|---|---|---|
| Week 1 | $67,100 | $61,500 | $5,600 | $139,600 | Below reserve |
| Week 2 | $49,500 | $45,800 | $3,700 | $143,300 | Below reserve |
| Week 3 | $66,900 | $71,000 | -$4,100 | $139,200 | Below reserve |
| Week 4 | $55,100 | $33,600 | $21,500 | $160,700 | OK |
| Week 5 | $70,350 | $86,800 | -$16,450 | $144,250 | Below reserve |
| Week 6 | $63,450 | $41,900 | $21,550 | $165,800 | OK |
| Week 7 | $71,950 | $68,400 | $3,550 | $169,350 | OK |
| Week 8 | $52,400 | $50,300 | $2,100 | $171,450 | OK |
| Week 9 | $73,200 | $77,100 | -$3,900 | $167,550 | OK |
| Week 10 | $56,800 | $67,900 | -$11,100 | $156,450 | OK |
| Week 11 | $71,250 | $86,100 | -$14,850 | $141,600 | Below reserve |
| Week 12 | $55,900 | $47,000 | $8,900 | $150,500 | OK |
| Week 13 | $80,650 | $73,700 | $6,950 | $157,450 | OK |
The full 13-week period starts with $134,000 of opening cash, collects $834,550, pays $811,100, and ends at $157,450. Net cash flow for the period is positive $23,450.
That sounds comfortable if you only look at the ending number, but the weekly view tells a better story. The lowest ending cash is $139,200 in Week 3, which is $10,800 below the $150,000 reserve target. The forecast spends five weeks below reserve: Weeks 1, 2, 3, 5, and 11. Week 13 has the highest receipts at $80,650, while Week 5 has the largest payments at $86,800.
This is exactly why I like a 13-week forecast. A monthly report might say the quarter ends fine. The weekly forecast shows when the business is tight, which week needs attention, and whether the fix is collection timing, payment timing, or a short-term funding decision.
How do I use this in Google Sheets?
Google Sheets is a first-class destination for this workbook. Open Google Sheets, choose File > Import > Upload, select the downloaded .xlsx, and choose either Create new spreadsheet or Insert new sheet(s). Every formula in the workbook — SUM, SUMIF, IF, IFERROR, INDEX, MATCH, ABS, ROUND, LARGE, and basic arithmetic — is supported in Google Sheets, so there are no formula substitutions to make after import.
The blue input cells, yellow calculation cells, green output cells, and dropdown/numeric validation come across in the import path I designed for. After importing, check the Summary sheet against the workbook example: opening cash should be $134,000, total receipts should be $834,550, total payments should be $811,100, ending cash should be $157,450, and weeks below reserve should be 5. If those numbers match before you start editing, the import worked.
If you’d rather skip the download-and-import step entirely, use this one-click copy link: make a copy of the Cash Flow Forecast Template in Google Sheets. Google will prompt you to save it to your own Drive, and from there it behaves identically to the Excel version — same sheets, same formulas, same 13-week cash roll-forward. If you prefer the manual path, download the .xlsx, import it into Google Sheets, then use File > Share or File > Make a copy from inside your own Drive.
If you are newer to the differences between the two spreadsheet apps, my comparison of Google Sheets and Excel is a useful companion. If you only need to open or inspect the file before editing it, the Excel viewer guide covers browser and desktop options.
How this differs from a monthly cash flow projection
A monthly projection is useful for planning, but it hides timing. Payroll does not wait until the end of the month to become real. Rent does not spread itself evenly over four weeks. A customer collection that lands on the 29th does not help a supplier payment that clears on the 12th. That is the gap this excel cash flow template is built to show.
The workbook does not try to replace your budget or financial statements. I would still use a budget spreadsheet for annual planning and a finance dashboard excel template for monthly budget-versus-actual reporting. This file sits closer to the cash desk: what will the bank balance look like each week if the receipts and payments happen when we currently expect them to happen?
I also kept the model intentionally editable. You can add receipt rows for important customers, split supplier payments by vendor, or separate payroll taxes from payroll if that matters in your business. The key is to preserve the weekly columns and the total rows feeding the forecast. Add detail on the input sheets, not by typing over the forecast formulas.
Limitations to know before you rely on this
A few things are worth knowing before you put real numbers into the template:
- This is a cash timing model, not an accounting system. It does not create invoices, post journal entries, reconcile bank accounts, or produce accrual-basis financial statements.
- The forecast is only as good as the timing inputs. If a customer usually pays 20 days late, do not put that receipt in the invoice week just because the invoice says net 15.
- The reserve target is a judgment call. The sample uses $150,000, but your real cushion may be based on payroll, debt covenants, supplier expectations, seasonality, or owner comfort.
- Grouped rows trade precision for speed. Grouping small payments into “Other operating payments” keeps the model readable, but it can hide a specific bill if that bill is large enough to matter.
- Ties return the first matching week. The Summary sheet uses a Google Sheets-compatible
LARGEplusMATCHpattern for highest receipt/payment weeks. If two weeks tie exactly, the first matching week is returned. - No macros, no external connections. That is deliberate. The workbook stays portable between Excel and Google Sheets because it relies on native worksheet formulas only.
I would rather keep those limits visible than pretend a spreadsheet is more automated than it is. Used properly, this cash flow template google sheets and Excel workflow gives you a disciplined weekly view of near-term liquidity. It will not make the cash decisions for you, but it will show you the week where the decision has to be made.
Download the cash flow forecast template and start by replacing the opening cash, receipts, and payments with your own numbers. The 13-week forecast and summary will follow automatically.
