
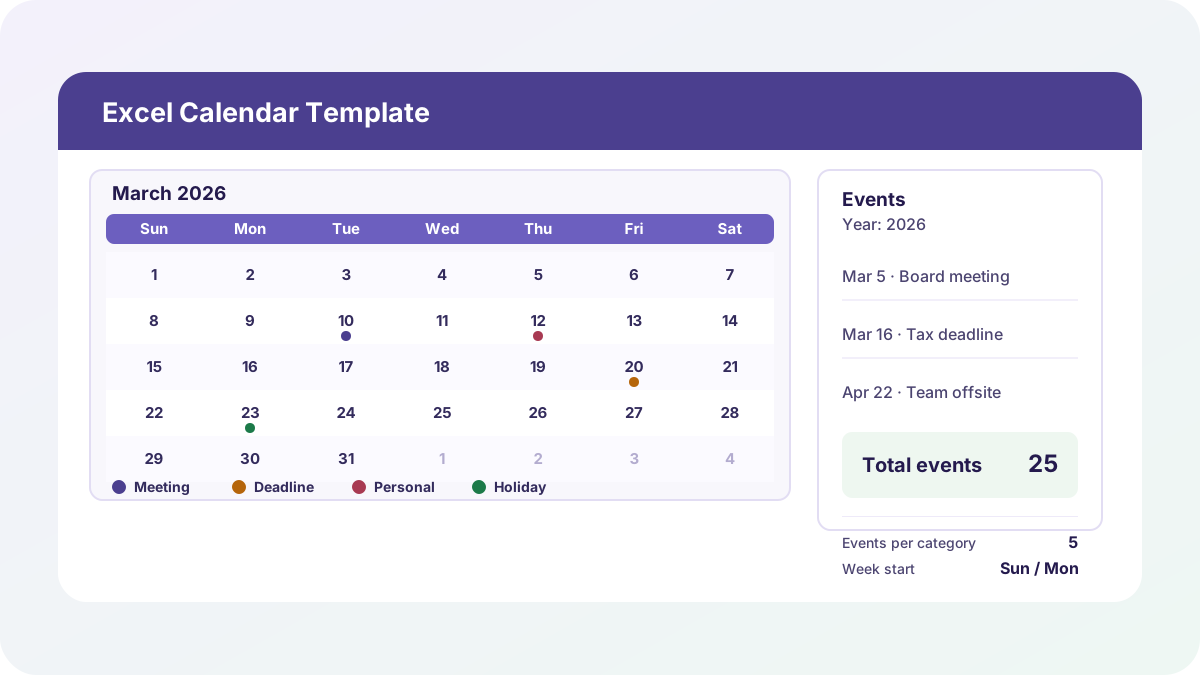
Every “Excel calendar template” I’d found before building this one was really just a static month grid you retyped by hand every January — no live day-of-week alignment, no leap-year handling, and definitely nowhere to actually log what’s happening on those dates. This excel calendar template fixes that: type a Year and a Week Start choice once, and all 12 months lay themselves out correctly — including February 29 in a leap year — while a separate event log rolls up into automatic per-month and per-category counts.
Download the excel calendar template — it’s a plain .xlsx, no macros, no external data connections, and no sign-up. Open it in Excel or Google Sheets and start typing your own year and events.
Who is this template for?
I built this for anyone who wants one annual calendar view they can drop a year into and trust — a small-business owner planning around a fiscal or calendar year, a freelancer mapping out launch dates and deadlines, or anyone tired of rebuilding a January-through-December grid from scratch each year. If you’ve been searching for a yearly calendar template excel file, an annual calendar excel workbook, or something that handles a leap year calendar excel correctly without you checking a calendar app first, this one workbook does the date math for you and gives you a place to log the events that go with it.
What’s in the workbook, sheet by sheet
The workbook ships with five visible sheets, in this exact order (plus one hidden helper sheet the formulas read from, more on that below):
- Instructions — setup steps, a sheet-by-sheet overview, and a clean-room disclosure: every formula, layout, and sample figure in this workbook was authored from scratch for Excel.TV. No vendor template, workbook, or dataset was downloaded, inspected, or adapted to build it.
- Settings — two inputs that drive the entire workbook: Year and Week Start (Sunday or Monday), plus a live leap-year check for whatever Year you type.
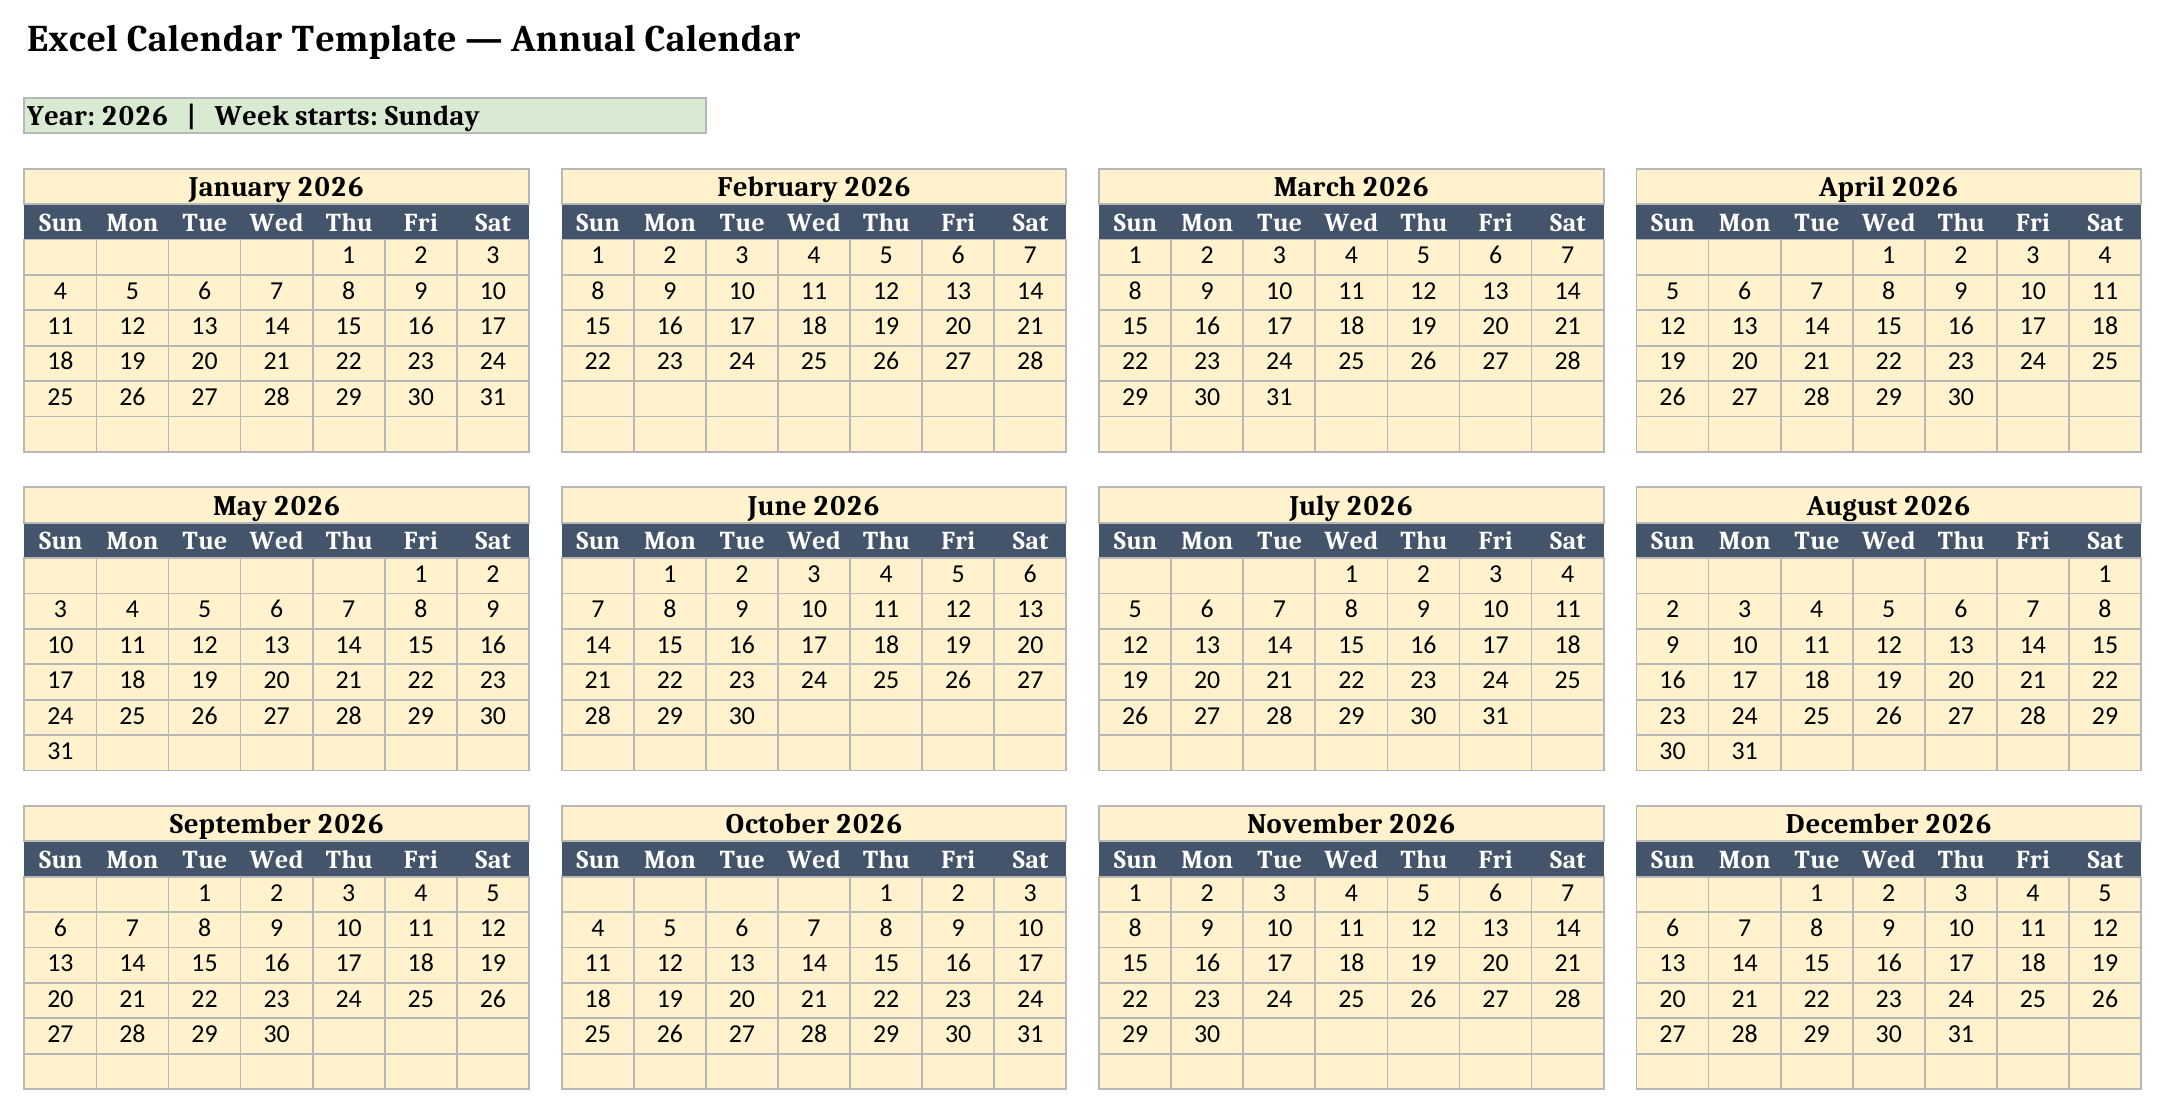
- Calendar — the annual calendar itself: all 12 months, each laid out as a real weekday-aligned grid (7 day columns × 6 week rows), built entirely from the Year and Week Start on Settings.
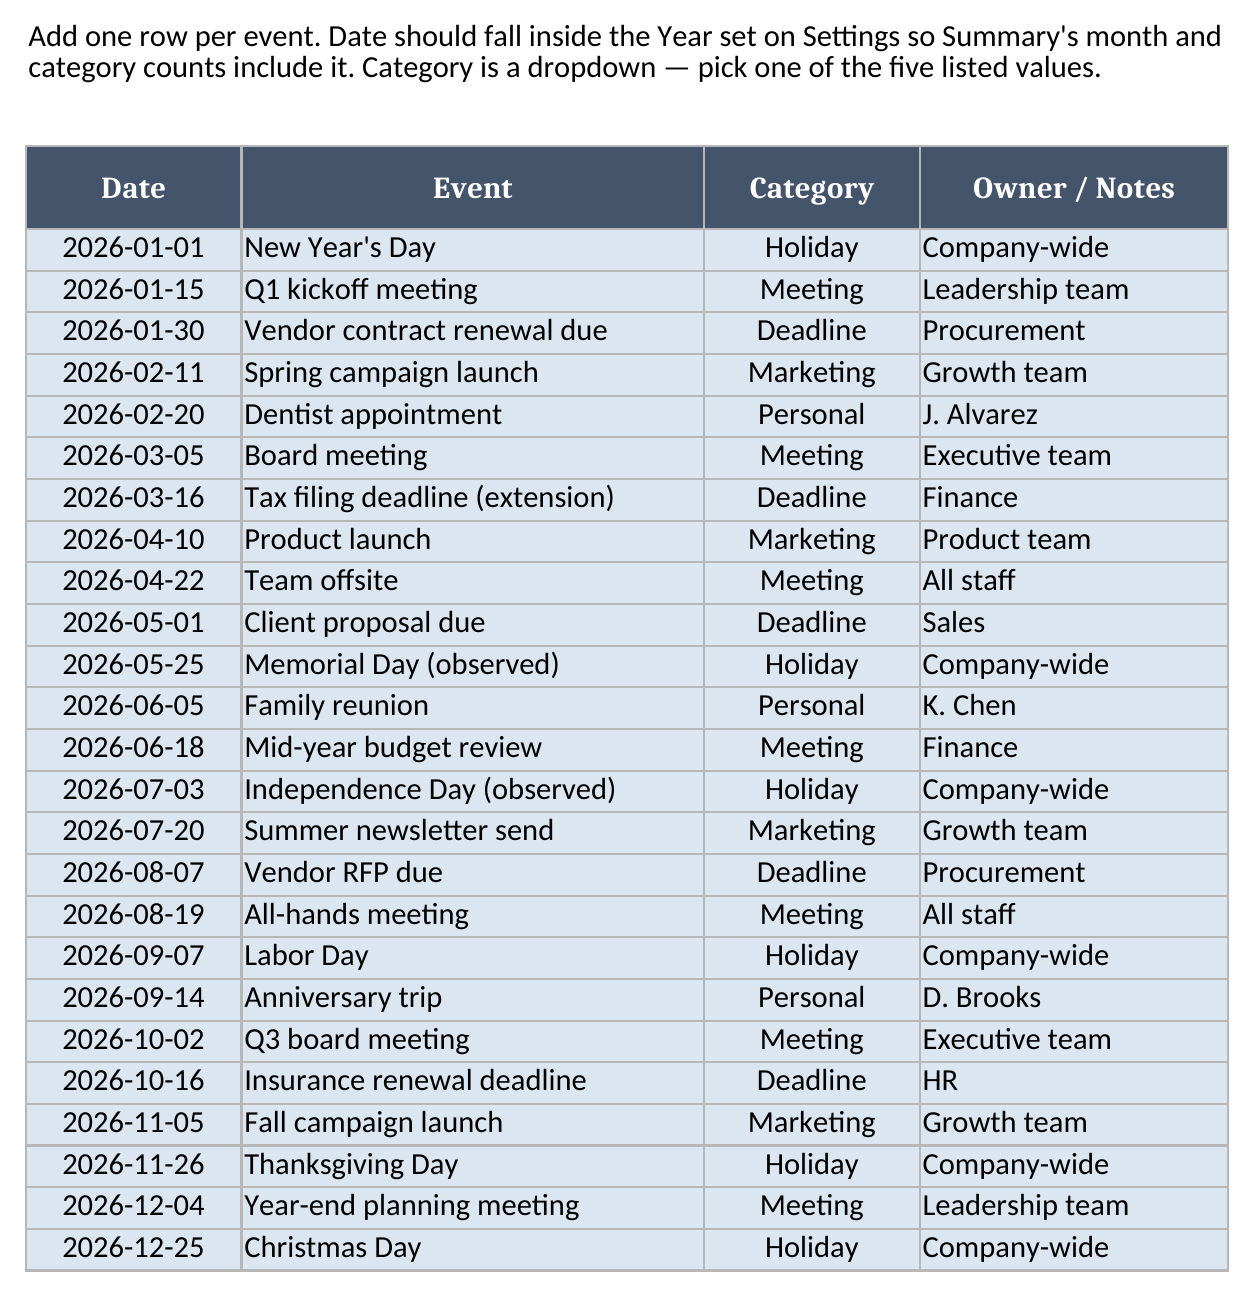
- Events — your event log: Date, Event, Category (dropdown), and Owner/Notes. Add, edit, or delete rows here — Summary reads from this list automatically.
- Summary — events per month and events per category, counted automatically from Events, plus two “Total Events (Check)” totals.
The required inputs are the Year and Week Start on Settings, and a Date/Event/Category/Notes row per event on Events. The main outputs are Calendar’s 12 month grids and Summary’s per-month and per-category counts, all of which recalculate the instant you change a Settings input or an Events row.
How do I set up the calendar and start logging events?
- Open Settings and type the Year you want (any year from 1900 to 2100 — data validation blocks anything outside that range) and choose Sunday or Monday as your Week Start. Check the leap-year message underneath; it updates the moment you change the Year.
- Open Calendar and review the full annual grid. Blank cells before the 1st of a month, or after its last day, are correct — not every grid position is a real date, and a 30-day month or February simply leaves those trailing cells empty.
- Open Events and replace the 25 sample rows with your own: a Date, an Event name, a Category from the dropdown (Meeting, Deadline, Marketing, Personal, or Holiday), and Owner/Notes.
- Open Summary and review Events per month and Events per category — both update automatically as you add, edit, or delete rows on Events.
How the month grids and the Events-to-Summary link actually work
The mechanic most homemade calendar templates skip is making the grid genuinely respond to a changed year rather than being retyped by hand. Behind the scenes, a hidden Calendar Helpers sheet computes, once per month, that month’s first date (=DATE(Year,Month,1)), its day count (=DAY(EOMONTH(FirstDate,0))), and its weekday offset (=WEEKDAY(FirstDate,...)) — all driven from the Year and Week Start on Settings. Every visible day cell on Calendar is then a single nested-IF formula that takes its position in the 7×6 grid, subtracts that month’s offset, and resolves to the day number if the result falls between 1 and the month’s day count, or to an empty string otherwise. That’s what makes a 30-day April correctly leave its 31st grid cell blank, and what makes February show 28 or 29 days depending on the Year you type — I confirmed this directly by switching Settings’ Year to 2024: the leap-year message flipped to “Leap year — February has 29 days,” February’s grid placed day 29 in its correct cell, and the very next grid cell (day 30, which doesn’t exist in February) stayed blank rather than showing an error.
The Events-to-Summary link is simpler but just as automatic. Each of Summary’s 12 month rows runs a COUNTIFS against Events’ Date column, bounded by DATE(Year,Month,1) on one side and EOMONTH(DATE(Year,Month,1),0) on the other — so it’s the Settings Year, not the calendar year the dates happen to fall in, that determines which events count. Each of Summary’s five category rows runs a plain COUNTIF against the Category column instead. Change a Category dropdown or retype a Date on Events, and the matching Summary row updates without you touching a formula.
Worked example: 25 sample events, one reconciled Summary
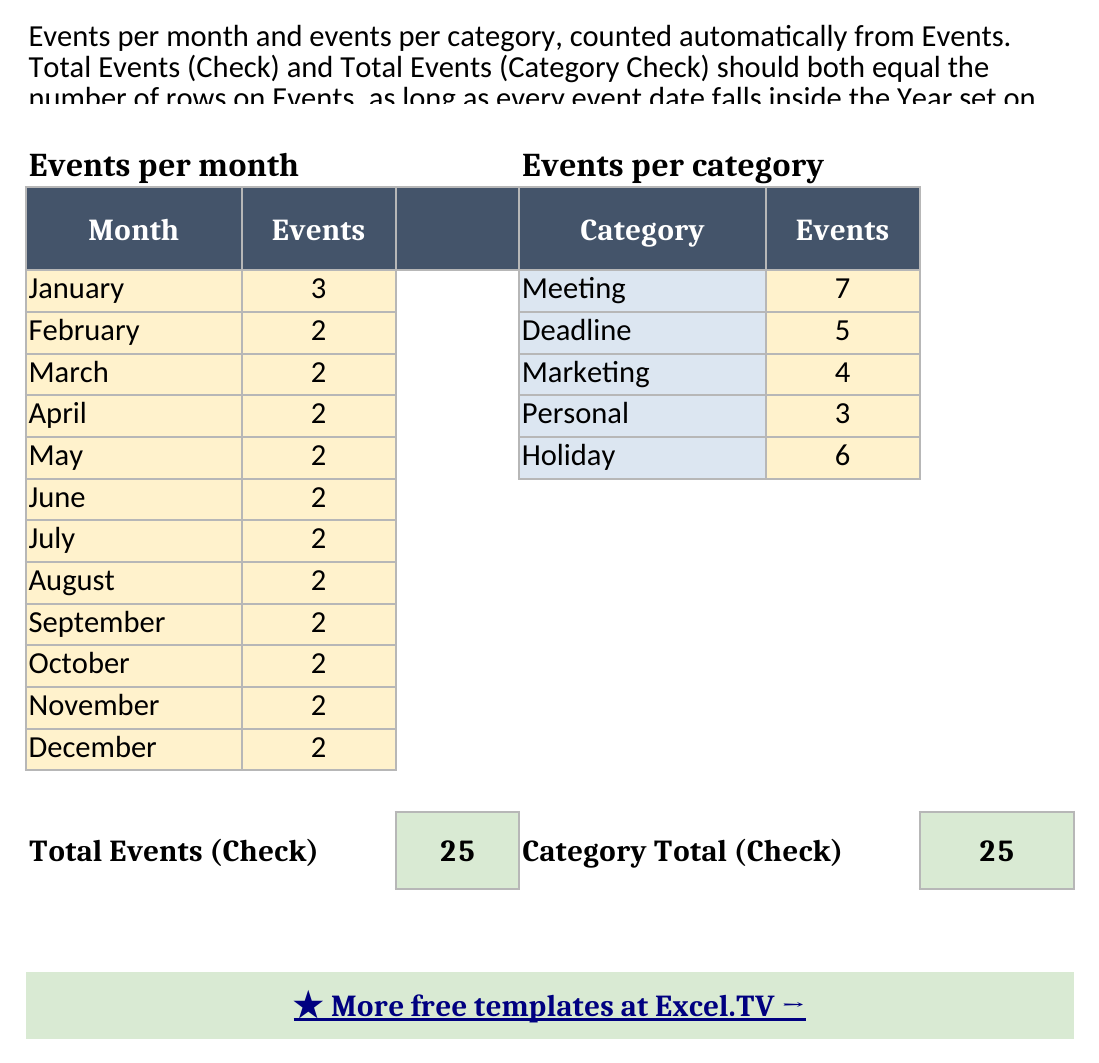
Here’s the full Summary output for the sample Year (2026) and the 25 sample events, pulled straight from the workbook after a full formula recalculation:
Events per month
| Month | Events |
|---|---|
| January | 3 |
| February | 2 |
| March | 2 |
| April | 2 |
| May | 2 |
| June | 2 |
| July | 2 |
| August | 2 |
| September | 2 |
| October | 2 |
| November | 2 |
| December | 2 |
| Total Events (Check) | 25 |
Events per category
| Category | Events |
|---|---|
| Meeting | 7 |
| Deadline | 5 |
| Marketing | 4 |
| Personal | 3 |
| Holiday | 6 |
| Category Total (Check) | 25 |
I re-derived January’s count by hand before trusting it: the sample Events sheet has exactly three rows dated in January 2026 — New Year’s Day (Jan 1), a Q1 kickoff meeting (Jan 15), and a vendor contract renewal deadline (Jan 30) — which matches the COUNTIFS result of 3 exactly. I did the same for the categories: counting every Events row tagged Holiday gives six (New Year’s Day, Memorial Day observed, Independence Day observed, Labor Day, Thanksgiving, and Christmas), matching Summary’s Holiday count of 6, and every row tagged Meeting gives seven, matching Summary’s Meeting count of 7.
Both check totals land on 25 — the exact number of rows on Events — which is the reconciliation to watch: if you fill in a full year of your own events and either check total stops matching your Events row count, that’s your signal an event’s date fell outside the Year set on Settings, or a Category cell has a typo that doesn’t match one of the five dropdown values.
How do I use this in Google Sheets?
Open Google Sheets, choose File > Import > Upload, select the downloaded .xlsx, and pick “Insert new sheet(s).” Every formula in this workbook — SUM, COUNTIF, COUNTIFS, IF, IFERROR, DATE, DAY, MONTH, YEAR, WEEKDAY, EOMONTH, TEXT, and the & concatenation operator — is natively supported in Google Sheets, so nothing needs to be rewritten. The Week Start and Category dropdowns also carry over automatically.
If you’d rather skip the download-and-import step entirely, use this one-click copy link: make a copy of the Excel Calendar Template in Google Sheets. Google will prompt you to save it to your own Drive, and from there it behaves identically to the Excel version — same sheets, same formulas, same leap-year and Summary logic.
If you’re tracking who’s in and out alongside your calendar, my attendance tracker template pairs naturally with this one — it handles daily attendance, PTO, and sick-leave balances on its own annual calendar view, so you can keep team scheduling and event planning in separate, purpose-built workbooks instead of overloading one sheet with both.
Limitations to know before you rely on this
A few things are worth knowing before you build a real year’s planning around this:
- One calendar year at a time. The workbook is driven entirely by the Year cell on Settings — it doesn’t model a fiscal-year offset or show more than one year at once. To plan across two years, you’d duplicate the workbook or change the Year and re-enter events for the new year.
- Summary only counts events inside the Settings Year. If you change Year without updating your Events dates to match, both check totals will drop toward zero — that’s expected, not a bug, and it’s your cue to add events for the new year or duplicate the workbook per year.
- The Calendar grid shows day numbers only. It doesn’t place individual events onto the grid itself, and it doesn’t auto-highlight weekends or holidays with conditional formatting — for that level of detail, use Events and Summary instead.
- No recurring-event logic. A weekly standing meeting needs one row per occurrence on Events; there’s no rule-based repeat.
- No timezone handling. Dates are plain calendar dates with no time-of-day or timezone component.
- No macros, no external connections. Everything here is a native formula. That’s deliberate — it’s what keeps the workbook portable between Excel and Google Sheets with zero substitutions.
I’d rather you know these limitations going in than run into one mid-year. Once your Year and Week Start are set on Settings, the rest of the workbook takes care of itself.
Download the excel calendar template and drop in your own year and events whenever you’re ready.
