
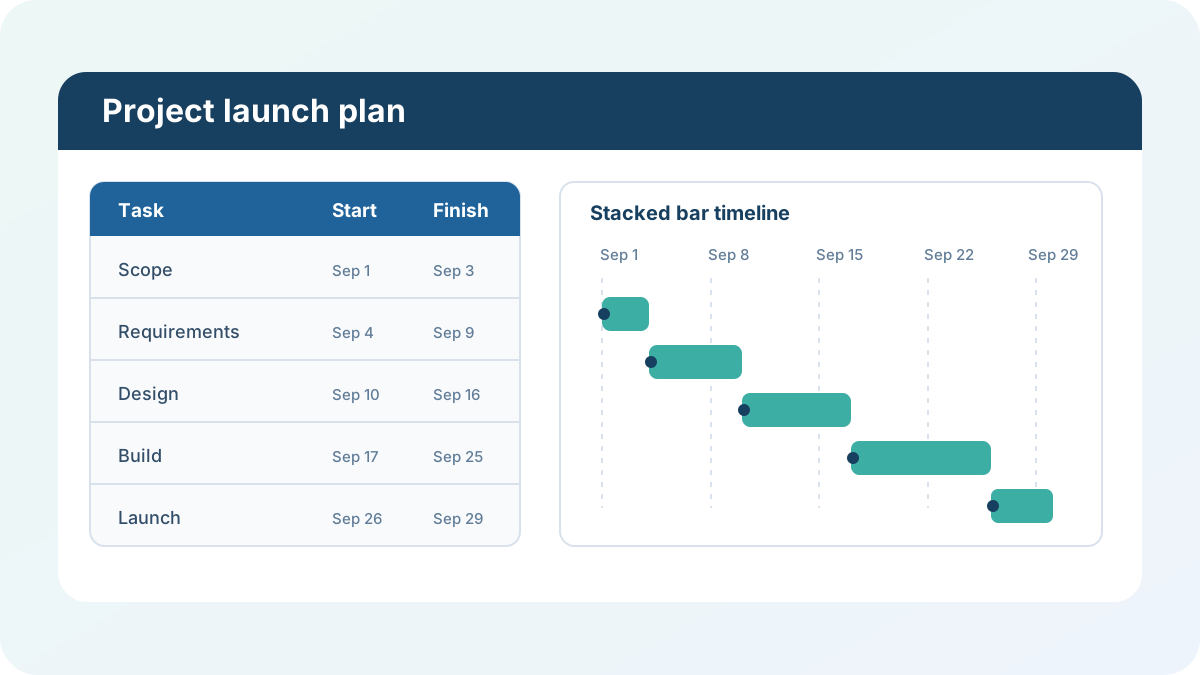
A Gantt chart in Excel turns a task list into a visual project timeline. The reliable method uses real start dates, a duration formula, and a stacked bar chart whose first series is hidden. This guide explains the entire setup and includes a working template you can adapt immediately.
Excel Gantt fact: Excel does not have a predefined Gantt chart type. Microsoft’s official method simulates one with a stacked bar chart, then removes the fill from the Start series. Source: Microsoft Support, “Present your data in a Gantt chart in Excel” (accessed July 24, 2026).
Download the Gantt chart Excel template to follow along with sample tasks, typed dates, inclusive duration formulas, a status drop-down, and a functional stacked bar chart.
How do you make a Gantt chart in Excel?
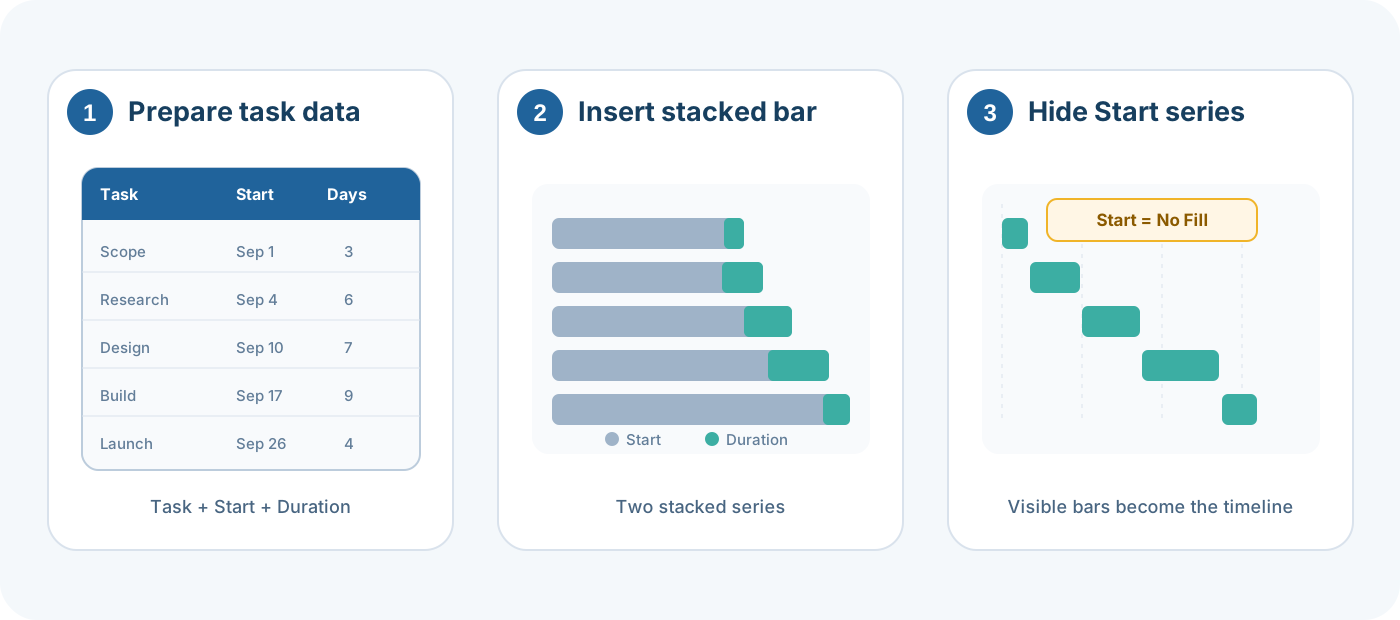
To make a Gantt chart in Excel, organize tasks with Start, Finish, and Duration columns, insert a stacked bar chart, and use Start plus Duration as its two series. Make the Start series transparent, reverse the task order, and format the horizontal value axis as dates so the visible bars become a readable schedule.
The complete workflow is:
- Enter one task per row.
- Store the start and finish as genuine Excel dates.
- Calculate duration from those dates.
- Select Task, Start, and Duration.
- Choose Insert > Bar Chart > 2-D Stacked Bar.
- Format the Start series with No Fill and No Line.
- Reverse the task categories.
- Set sensible minimum and maximum dates on the horizontal axis.
That hidden first series is the key. A stacked bar chart adds the Duration bar after the Start value. Hiding Start preserves its width as an offset, so the visible Duration bar begins at the correct date. You are not moving each task manually; the date values position every bar.
This approach is best for a straightforward schedule that needs familiar spreadsheet inputs. For a broader library of trackers, dashboards, and planning sheets, see our Excel templates for project management.
What data does an Excel Gantt chart need?
A basic Excel Gantt chart needs a task label, a start date, and a duration for every row. A finish date is strongly recommended because it is easier to review than duration alone. Owner, status, predecessor, milestone, and notes columns are optional metadata; they support management but do not position the standard chart bars.
Use a clean source table like this:
| Task | Owner | Start | Finish | Duration | Status |
|---|---|---|---|---|---|
| Confirm project scope | Maya | Sep 1, 2026 | Sep 3, 2026 | 3 | Complete |
| Gather requirements | Noah | Sep 4, 2026 | Sep 9, 2026 | 6 | Complete |
| Design solution | Priya | Sep 10, 2026 | Sep 16, 2026 | 7 | In Progress |
| Build prototype | Leo | Sep 17, 2026 | Sep 25, 2026 | 9 | Not Started |
Keep the chart-driving columns numeric. Dates that look correct but are stored as text will not provide dependable offsets or calculations. You can test a suspicious cell with =ISNUMBER(C2): TRUE means Excel recognizes the underlying date serial.
Do not include blank separator rows inside the chart source. Avoid merged cells in the task table, and keep every task on a single row. A structured Excel Table is helpful when the list will grow because its formulas, filters, and validation rules can expand with new records, although you should still confirm the chart’s source after adding rows.
How do you calculate task duration and project dates?
Excel stores dates as numbers, so duration is ordinary subtraction. If both boundary dates count, use =Finish-Start+1; without +1, a task beginning and ending on the same day returns zero. Use NETWORKDAYS when the schedule should count working days, and supply a holiday range when organizational closures must be excluded.
With Start in C2 and Finish in D2, the inclusive calendar-day formula is:
=D2-C2+1The result is 3 for a task running September 1 through September 3. That aligns with the common project-planning interpretation that work occurs on all three listed dates. If your organization treats Finish as an exclusive boundary, omit +1, but document that rule because readers often assume the finish day is included.
For Monday-to-Friday workdays, use:
=NETWORKDAYS(C2,D2,$J$2:$J$15)The absolute range contains holiday dates. NETWORKDAYS excludes standard weekends; NETWORKDAYS.INTL is better when the team uses a different weekend pattern. Note that a bar built from working-day duration still begins at a calendar date, so gaps caused by weekends may not read like a day-by-day work calendar.
Microsoft documents both functions in its date and time functions reference: NETWORKDAYS returns whole workdays, while NETWORKDAYS.INTL accepts custom weekend parameters (accessed July 24, 2026).
Useful project summary formulas include:
=MIN(C2:C20)
=MAX(D2:D20)
=MAX(D2:D20)-MIN(C2:C20)+1
These return the earliest start, latest finish, and inclusive calendar span. They also give you reliable axis boundaries. If your main goal is day-by-day appointment planning rather than task duration, an Excel calendar template may be a clearer visual.
How do you create the stacked bar Gantt chart?
Select the Task, Start, and Duration columns, including their headers, then insert a 2-D stacked bar chart. Excel may initially display large Start bars because dates are serial numbers. That is expected. Confirm the two series and category labels before formatting, because styling cannot rescue a chart whose ranges point to the wrong columns.
If the columns are adjacent, select the complete range and choose Insert > Bar Chart > 2-D Stacked Bar. If Finish sits between Start and Duration, hold Ctrl on Windows or Command on Mac while selecting the nonadjacent Task, Start, and Duration ranges.
Open Chart Design > Select Data and verify:
- Legend Entries (Series) contains Start and Duration.
- Horizontal (Category) Axis Labels points to the task names.
- Start and Duration contain the same number of values.
- Headers are used as series names, not plotted as data.
If tasks appear as separate series, click Switch Row/Column. A valid layout has one category per task and two horizontal segments per category. Start supplies the hidden offset, while Duration supplies the colored work bar.
Use the ordinary stacked bar, not 100% stacked. A 100% chart converts every row to a proportion, destroying the common date scale. Also avoid a clustered bar, which places Start and Duration beside each other instead of combining them into one position-plus-length bar.
Microsoft’s chart type reference likewise distinguishes ordinary stacked charts from 100% stacked charts, which show each category as a percentage (accessed July 24, 2026).
How do you hide the Start series and format the timeline?
Click the Start series, open Format Data Series, and choose No Fill plus No Line. The invisible values still offset each task. Then reverse the category order, reduce the gap width, and format the horizontal value axis with a date number format and boundaries close to the project’s actual start and finish.
To put the first task at the top, select the vertical task axis and enable Categories in reverse order. Excel may move the date axis to the top; if that happens, adjust where the horizontal axis crosses so labels return to the preferred edge.
For the horizontal axis:
- Set Minimum near the earliest project start.
- Set Maximum just after the latest finish.
- Use a number format such as
mmm dormmm d, yyyy. - Choose a major unit that avoids crowded labels.
The axis dialog may show date serial numbers instead of readable dates in its boundary boxes. That is normal: formatting controls how the values appear on the chart. You can temporarily enter the desired dates in worksheet cells, switch those cells to General format, and use the resulting serials as boundaries.
Finally, use one purposeful color for active task bars, remove heavy borders, and keep gridlines subtle. A title such as Website launch schedule communicates more than Gantt Chart because it names the project, not the chart mechanism.
How can you add progress, milestones, and dependencies?
Progress, milestones, and dependencies can extend the chart, but each needs a distinct modeling choice. Progress is usually a second visible duration series, milestones use a one-day bar or separate marker, and dependencies live in a predecessor column or connector shapes. Keep those additions formula-driven where possible so edits remain auditable.
For progress, calculate completed duration:
=Duration*PercentCompleteThen calculate remaining duration:
=Duration-CompletedDurationBuild the chart from Start, Completed Duration, and Remaining Duration. Keep Start invisible, use a strong color for completed work, and a lighter tint for remaining work. Store percent complete as a true percentage, such as 40%, rather than text like “40 percent.”
For milestones, a one-day task is the simplest reliable option in a bar chart. Label it clearly and apply a contrasting color. A true diamond marker requires a combo chart or manually positioned shape, which adds maintenance. If the schedule changes often, favor the simple bar because it remains connected to worksheet data.
Excel does not automatically reschedule dependent tasks when predecessors move. You can record predecessor task IDs and calculate a successor start with a formula such as =PreviousFinish+1, but multiple dependency types and constraints become difficult quickly. Dedicated project software is safer when automatic critical-path scheduling is required.
When is a conditional-formatting timeline better?
A conditional-formatting Gantt is better when you need a day-by-day grid, visible weekends, or direct editing beside each date. A stacked bar chart is better for a compact executive timeline. The grid consumes more columns but makes exact daily coverage obvious, while the chart scales more gracefully across longer schedules and presentation layouts.
To make the grid, put timeline dates across row 1 and task Start and Finish values in fixed columns. Select the timeline body and add a formula-based conditional-formatting rule:
=AND(H$1>=$C2,H$1<=$D2)The formula fills a cell when its column date falls between that row’s Start and Finish. Add separate rules for weekends, today, milestones, or completed work. Keep rule order deliberate so one fill does not unexpectedly hide another.
The grid is often easier to troubleshoot because every colored cell corresponds to one date. It also prints well for short schedules. The stacked bar method is usually cleaner for quarters or multi-month plans where a daily matrix would become extremely wide.
How do you use the downloadable Gantt template?
The downloadable workbook includes eight sample tasks, real date values, formula-derived durations, a status drop-down, summary dates, and a native stacked bar chart. Replace the sample inputs first, preserve the Duration formulas, and check the chart after inserting rows. The template counts calendar days, including both Start and Finish.
Download the Gantt chart Excel template, open the Gantt Plan sheet, and follow these steps:
- Replace the sample task names and owners.
- Enter Start and Finish as dates, not text.
- Choose a status from the drop-down.
- Copy a nearby Duration formula when adding a row.
- Extend the chart series ranges to include any new tasks.
- Review project start, project finish, and total span.
The chart uses direct references to the worksheet task names, start dates, and duration formulas. Editing those cells updates the timeline in Excel. The Status column is useful for filtering and review, but it does not alter the bar color automatically.
Before sharing the file, inspect the first and last task, confirm the longest task, and compare at least one duration against manual date counting. Those three checks catch most range and off-by-one problems.
What are the most common Gantt chart mistakes?
Most Excel Gantt problems come from invalid dates, inconsistent duration logic, or chart ranges that stop before the newest tasks. Other frequent issues include using a clustered or 100% stacked chart, leaving the Start series visible, setting an axis minimum near zero, and manually moving bars instead of correcting source values.
Use this troubleshooting checklist:
- Bars are tiny at the far right: set the value-axis minimum near the earliest Start date.
- Tasks run backward: confirm Finish is on or after Start.
- One-day tasks disappear: use inclusive duration with
+1. - Task order is upside down: reverse the vertical category axis.
- Dates appear as numbers: apply a date number format to the value axis.
- New tasks are missing: extend the series and category ranges.
- Bars sit side by side: change the chart to 2-D stacked bar.
- Every bar fills the width: replace 100% stacked with ordinary stacked.
Do not type over duration formulas with hand-counted values. Formula-driven durations keep the chart traceable, make schedule changes safer, and expose invalid inputs. If a bar looks wrong, inspect its Start, Finish, and Duration cells before changing chart formatting.
FAQ
These answers cover the decisions that usually matter after the first chart is built: whether Excel has a native Gantt type, which duration formula to use, how updates flow from source cells, and how far milestones or dependencies can be modeled. The same four answers appear in the page’s structured FAQ data.
Does Excel have a built-in Gantt chart?
No. Excel does not include a dedicated Gantt chart type. The standard method is to create a stacked bar chart from task start dates and durations, then make the Start series invisible so only the duration bars appear on the timeline.
What formula calculates duration for an Excel Gantt chart?
For calendar days that include both the start and finish date, use =Finish-Start+1. If weekends and holidays should be excluded, use NETWORKDAYS(Start,Finish,Holidays), where Holidays refers to an optional range of nonworking dates.
How do I make an Excel Gantt chart update automatically?
Build the chart from worksheet cells that contain real dates and formula-derived durations. When you edit those source cells, Excel recalculates the formulas and redraws the chart. Convert the range to a Table or extend the chart source when adding tasks.
Can I show milestones and dependencies in an Excel Gantt chart?
Yes, but they require extra setup. Represent a milestone as a zero- or one-day task and format it distinctly. Dependencies are usually maintained in a predecessor column or drawn as shapes; Excel does not manage linked scheduling logic like dedicated project software.
