
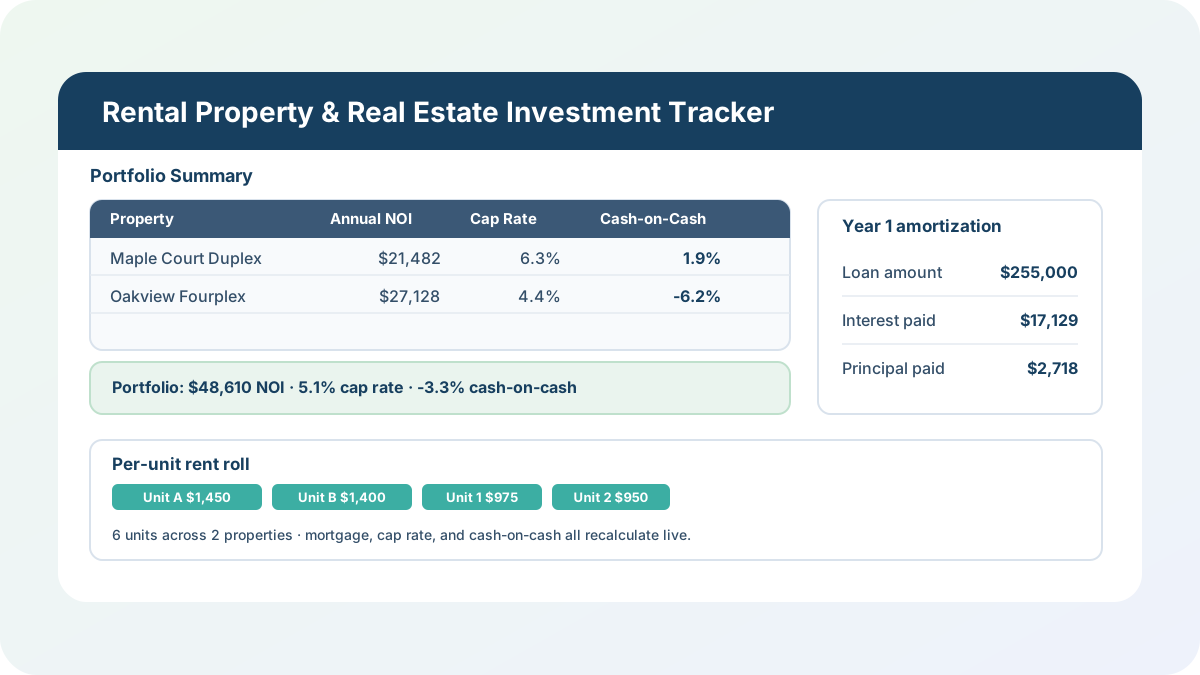
I keep a running count of how many times a landlord has emailed me a screenshot of their bank statement asking “is this a good deal?” — and the honest answer is always some version of “I can’t tell you without knowing your NOI, your debt service, and your down payment.” Most small landlords never separate those numbers, so they end up judging a property on cash flow they remember from three months ago instead of a number they can actually compare across their whole portfolio. This rental property spreadsheet is my answer to that: one workbook that takes a per-unit rent roll and a set of expense assumptions and turns them into cap rate, cash-on-cash return, and a portfolio summary you can update every month.
Download the rental property spreadsheet — it’s a plain .xlsx, no macros, no external data connections, and no sign-up. Open it in Excel or Google Sheets and start replacing the sample properties with your own.
Who is this template for?
I built this for someone holding two, three, or a handful of rental properties — enough that “keep it in my head” has stopped working, but not so many that a dedicated property-management platform makes sense yet. If you can pull a purchase price, a loan’s rate and term, a handful of monthly expense numbers, and each unit’s rent, you can drop them into this workbook and get cap rate, cash-on-cash return, and a side-by-side portfolio comparison out the other end. It also works as a teaching example if you want to see how INDEX/MATCH, SUMIF, and an arithmetic amortization formula tie a rent roll to a mortgage schedule to a KPI dashboard, all in one connected model.
What’s in the workbook, sheet by sheet
The workbook ships with five sheets, in this exact order, because each one builds on the sheet before it:
- Instructions — a short setup guide plus a clean-room disclosure: every formula, layout, and sample figure in this workbook was authored from scratch for excel.tv. No vendor template, workbook, or dataset was downloaded, inspected, or adapted to build it.
- Properties — one row per property: purchase price, down payment, loan terms, and the monthly expense assumptions (property tax, insurance, HOA, vacancy rate, maintenance reserve, CapEx reserve, management fee). The monthly mortgage payment and annual debt service are calculated automatically the moment you enter a loan amount and rate.
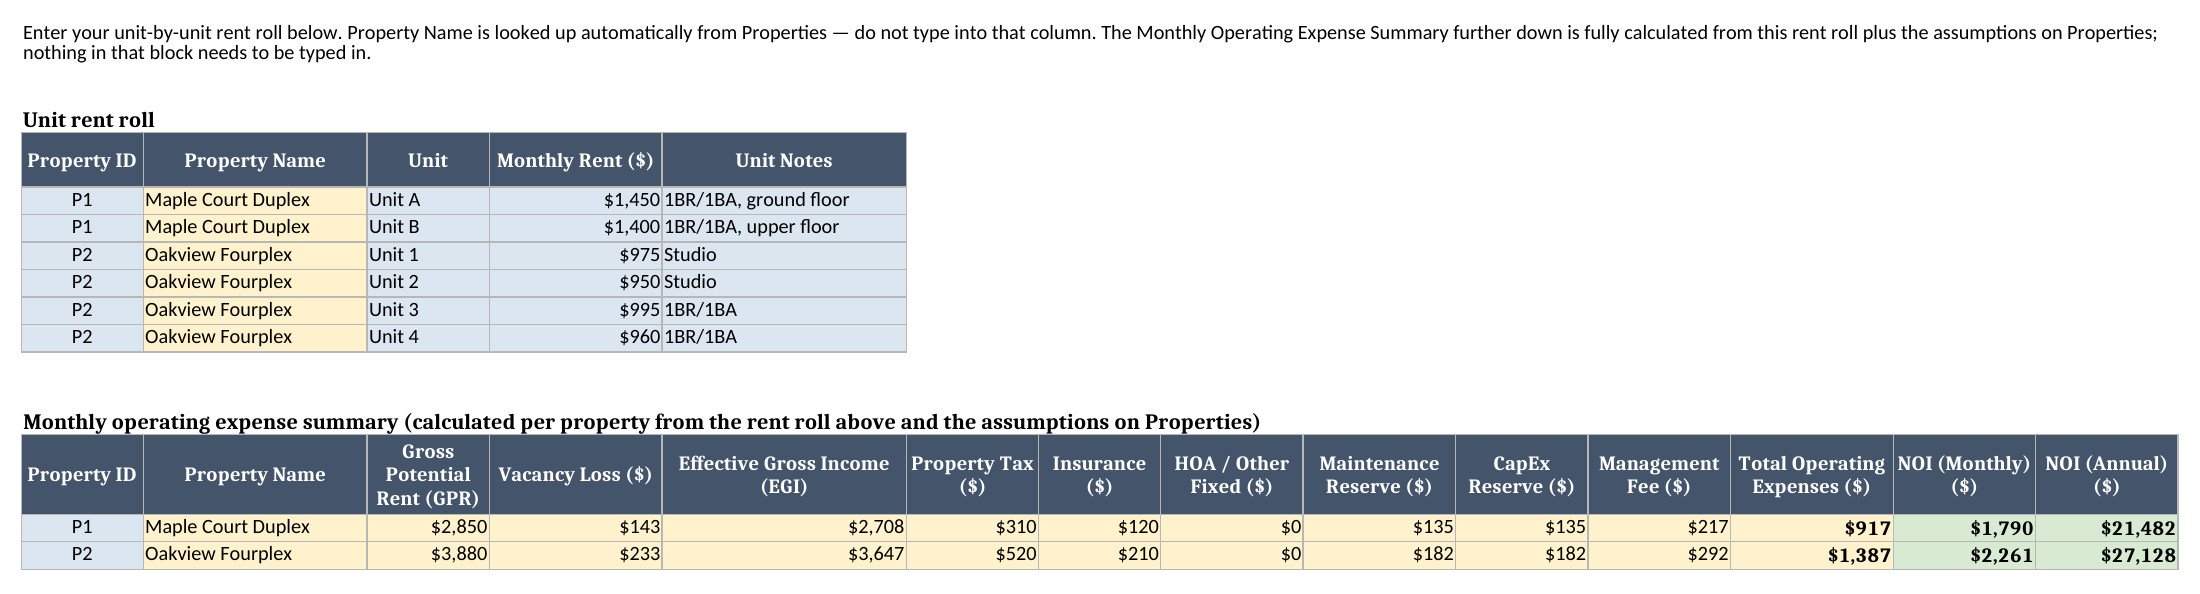
- Income & Expenses — a per-unit rent roll where you enter each unit’s monthly rent, and a calculated Monthly Operating Expense Summary below it that rolls every unit up into gross potential rent, vacancy loss, effective gross income, itemized expenses, and net operating income (NOI).
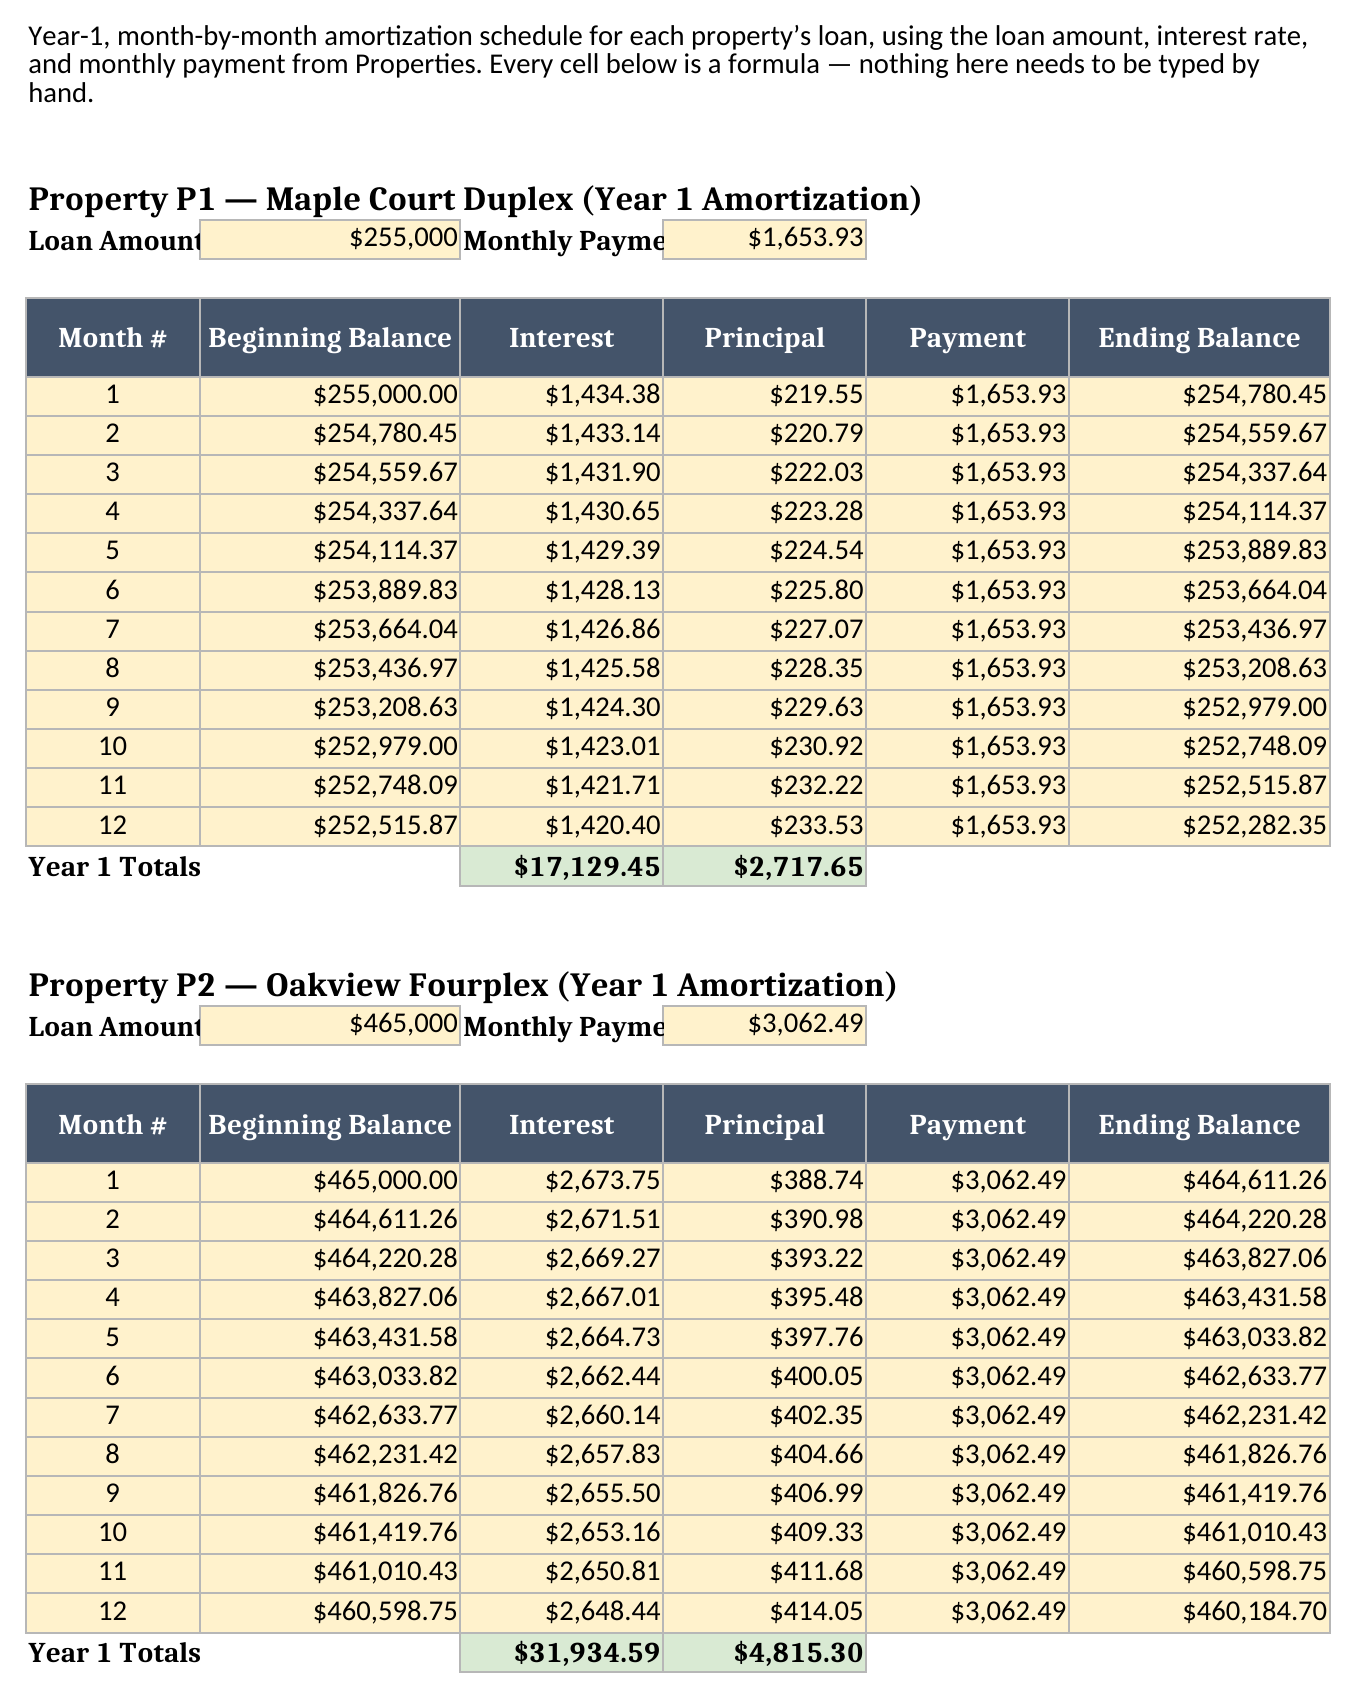
- Mortgage — a year-1, month-by-month amortization schedule for every property’s loan, so you can see exactly how much of your first year’s payments went to interest versus principal.
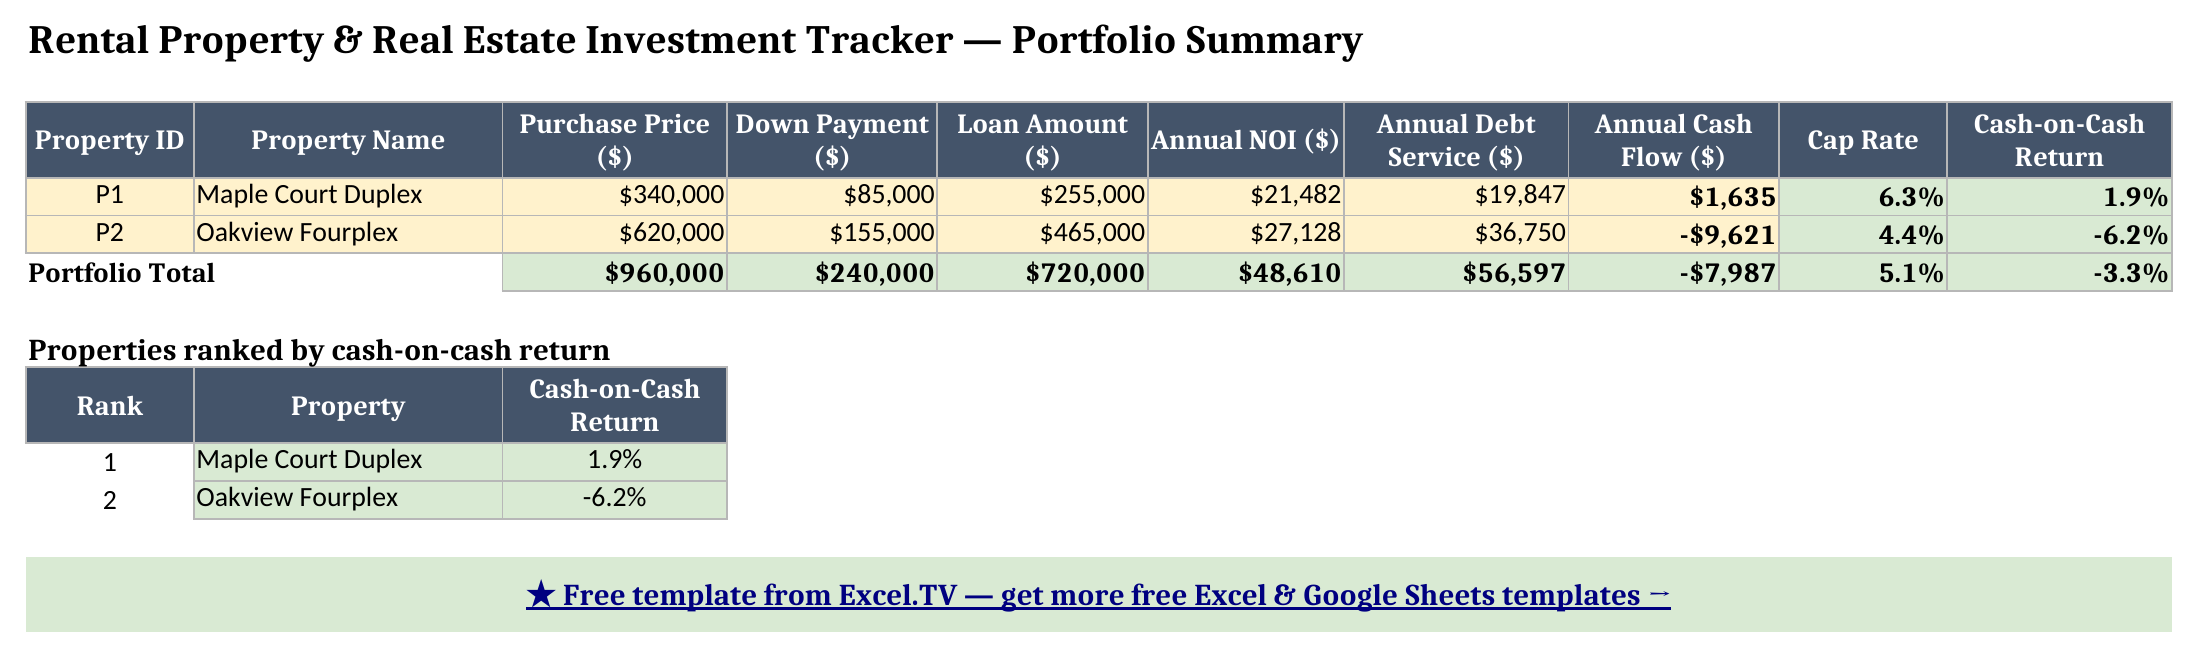
- Portfolio Summary — the one-page rollup: purchase price, down payment, loan amount, annual NOI, annual debt service, annual cash flow, cap rate, and cash-on-cash return, per property and for the whole portfolio, plus a ranking of which property is currently your best (or worst) cash-on-cash performer.
The required inputs are the property-level assumptions on Properties and the unit-level rents on Income & Expenses. The main outputs are everything on Portfolio Summary — all of it recalculates the instant you edit a rent, an expense assumption, or a loan term.
How do I set up the rental property tracker?
- Open Properties and replace the sample purchase price, down payment percentage, loan terms, and expense assumptions with your own for each property — add a new row for each additional property, giving it a unique Property ID.
- Open Income & Expenses and enter your own unit-by-unit rent roll in the top block. Don’t type into the Property Name column — it’s a formula that looks the name up from Properties automatically.
- Check the Monthly Operating Expense Summary below the rent roll: gross potential rent, vacancy loss, effective gross income, and NOI all recalculate from what you just entered.
- Open Mortgage to see each property’s year-1 amortization schedule.
- Go to Portfolio Summary to see cap rate, cash-on-cash return, and the portfolio totals across every property.
Because Property Name on Income & Expenses is an INDEX/MATCH formula rather than typed text, a typo in a Property ID shows up immediately as “(unknown property)” instead of silently producing a $0 row later.
How the mortgage amortization link works
The Properties sheet computes each loan’s standard monthly payment arithmetically, from the same textbook amortization formula my loan amortization schedule template uses — not a PMT function — so it evaluates identically in Excel, Google Sheets, and LibreOffice. The Mortgage sheet then pulls that payment, the loan amount, and the interest rate straight from Properties and builds a real month-by-month schedule: each month’s interest is the prior balance times the monthly rate, principal is whatever’s left of the payment after interest, and the ending balance carries into the next row.
I capped the schedule at year 1 on purpose — twelve rows per property is enough to answer “how much of what I’m paying this year is actually interest?” without turning the workbook into a 360-row scroll fest for a 30-year loan. In the sample data, the $255,000 loan behind the Maple Court Duplex pays $17,129 in interest and only $2,718 in principal across its first 12 payments — a reminder of just how front-loaded a standard amortization schedule is in year one.
Worked example: two properties, two very different outcomes
I built two synthetic multi-unit properties into the sample data specifically because a single “good deal” example doesn’t teach you anything — you need a contrast. Here’s what Portfolio Summary shows for both, pulled straight from the workbook:
| Property | Purchase Price | Annual NOI | Annual Debt Service | Annual Cash Flow | Cap Rate | Cash-on-Cash Return |
|---|---|---|---|---|---|---|
| Maple Court Duplex (2 units) | $340,000 | $21,482 | $19,847 | $1,635 | 6.3% | 1.9% |
| Oakview Fourplex (4 units) | $620,000 | $27,128 | $36,750 | -$9,621 | 4.4% | -6.2% |
| Portfolio Total | $960,000 | $48,610 | $56,597 | -$7,987 | 5.1% | -3.3% |
This is exactly the contrast I wanted the template to surface. Oakview Fourplex looks like the bigger earner if you just eyeball its rent roll — twice the units and $1,030 more in monthly rent — but at a $620,000 purchase price against $3,880 a month in combined rent, its debt service outruns its NOI — the property is bleeding $9,621 a year once you account for the mortgage. Maple Court Duplex, with a smaller loan and a lower purchase price relative to its rent, comes out modestly cash-flow positive instead. Neither number is visible from a bank statement alone; you only see it once cap rate and cash-on-cash return sit side by side, which is the entire point of tracking a portfolio instead of one property at a time.
Grab the rental property spreadsheet if you want to swap in your own numbers and watch which of your properties actually earns its keep.
How do I use this in Google Sheets?
Google Sheets is a first-class destination for this rental property tracker, not an afterthought. Open Google Sheets, choose File > Import > Upload, select the downloaded .xlsx, and pick “Insert new sheet(s).” Every formula in this workbook — SUM, SUMIF, IF, IFERROR, INDEX, MATCH, ABS, ROUND, LARGE, and the ^ exponent operator that drives the mortgage payment formula — is natively supported in Google Sheets, so nothing needs to be rewritten.
If you’d rather skip the download-and-import step entirely, use this one-click copy link: make a copy of the Rental Property & Real Estate Investment Tracker in Google Sheets. Google will prompt you to save it to your own Drive, and from there it behaves identically to the Excel version — same sheets, same formulas, same portfolio rollup.
If you’re financing one of these properties and want to model extra payments or a bi-weekly payoff schedule beyond the year-1 view here, my loan amortization schedule template is built specifically for that — it shares the same arithmetic payment formula this workbook uses on the Properties sheet, just extended across the full loan term with extra-payment and bi-weekly toggles.
Limitations to know before you rely on this
A few things are worth knowing before you put real numbers in:
- Vacancy is a flat assumption, not tracked occupancy. The sample rent roll shows every unit fully occupied; the Vacancy Rate percentage on Properties is your underwriting cushion applied against gross potential rent, not a reflection of which units are currently vacant. If you want month-by-month occupancy tracking, you’d need to extend the rent roll with an Occupied? column and wire vacancy loss to it directly.
- NOI excludes debt service, by design. Net Operating Income is Effective Gross Income minus operating expenses only — it deliberately leaves out mortgage principal and interest, which is standard real-estate practice. Annual Cash Flow, on Portfolio Summary, is where debt service gets subtracted.
- The Mortgage sheet only models year 1. It’s built to show the interest-versus-principal split for a loan’s first 12 payments, not the full amortization term — extending it further means copying the twelve-row block’s formulas down and re-pointing the “Year 1 Totals” row.
- Every Property ID must be unique and consistent across sheets. Properties, the Income & Expenses rent roll, and every downstream lookup all key off that ID — insert a property on one sheet without giving it a matching ID everywhere else and its rows won’t be found.
- No macros, no external connections. Everything here is a native formula. That’s deliberate — it’s what keeps the workbook portable between Excel and Google Sheets with zero substitutions.
I’d rather you find these limits reading this section than mid-portfolio-review. Once you know the NOI-excludes-debt-service rule and the Property ID rule, the rest of the workbook takes care of itself.
Download the rental property spreadsheet and start tracking your own portfolio.
