
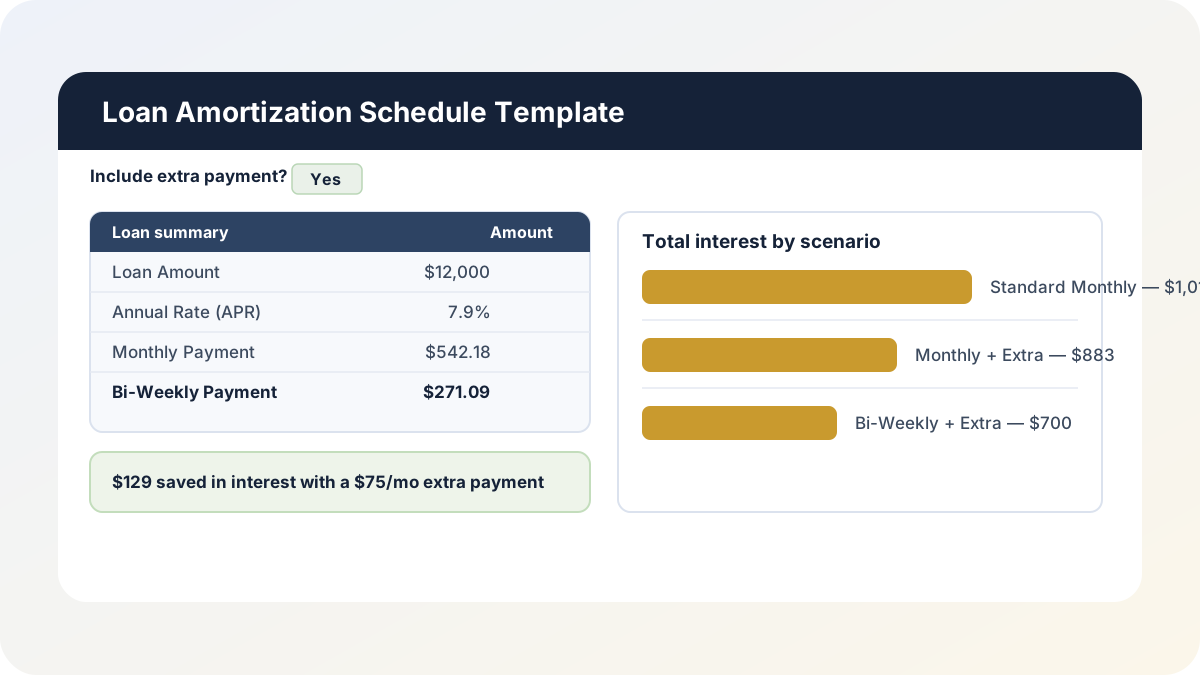
Every time I’ve helped someone shop for a car loan, refinance a personal loan, or just sanity-check what their bank’s amortization table is actually doing, I’ve ended up building some version of the same worksheet: a payment number, an interest split, a principal split, and a running balance, all tied back to a rate and a term. What I hadn’t built until now was a version that also answers the two questions people actually ask next — “what if I throw an extra $75 at it every month?” and “what if I just paid every two weeks instead?” This loan amortization schedule excel template answers both, side by side, from one set of inputs.
Download the loan amortization schedule excel template — it’s a plain .xlsx, no macros, no external data connections, and no sign-up. Open it in Excel or Google Sheets and swap in your own loan amount, rate, and term.
Who is this template for?
I built this for anyone staring down a fixed-rate installment loan — a personal loan, an auto loan, a short-term business loan, even a mortgage if you extend the row count — who wants to see the actual payment-by-payment math instead of trusting a black-box calculator widget. It’s also for the specific person who’s already decided they want to pay a loan off early and wants to know, in real dollars, whether an extra monthly payment or a switch to bi-weekly payments gets there faster and cheaper. And if you’re teaching or learning how amortization formulas actually work, this is a clean example of building a payment schedule from arithmetic instead of a black-box PMT function — you can see every multiplication.
What’s in the workbook, sheet by sheet
The workbook ships with five sheets, in this exact order, because each one depends on the sheet before it:
- Instructions — a short setup guide plus a clean-room disclosure: every formula, layout, and sample figure in this workbook was authored from scratch for Excel.TV. No vendor template, workbook, or dataset was downloaded, inspected, or adapted to build it.
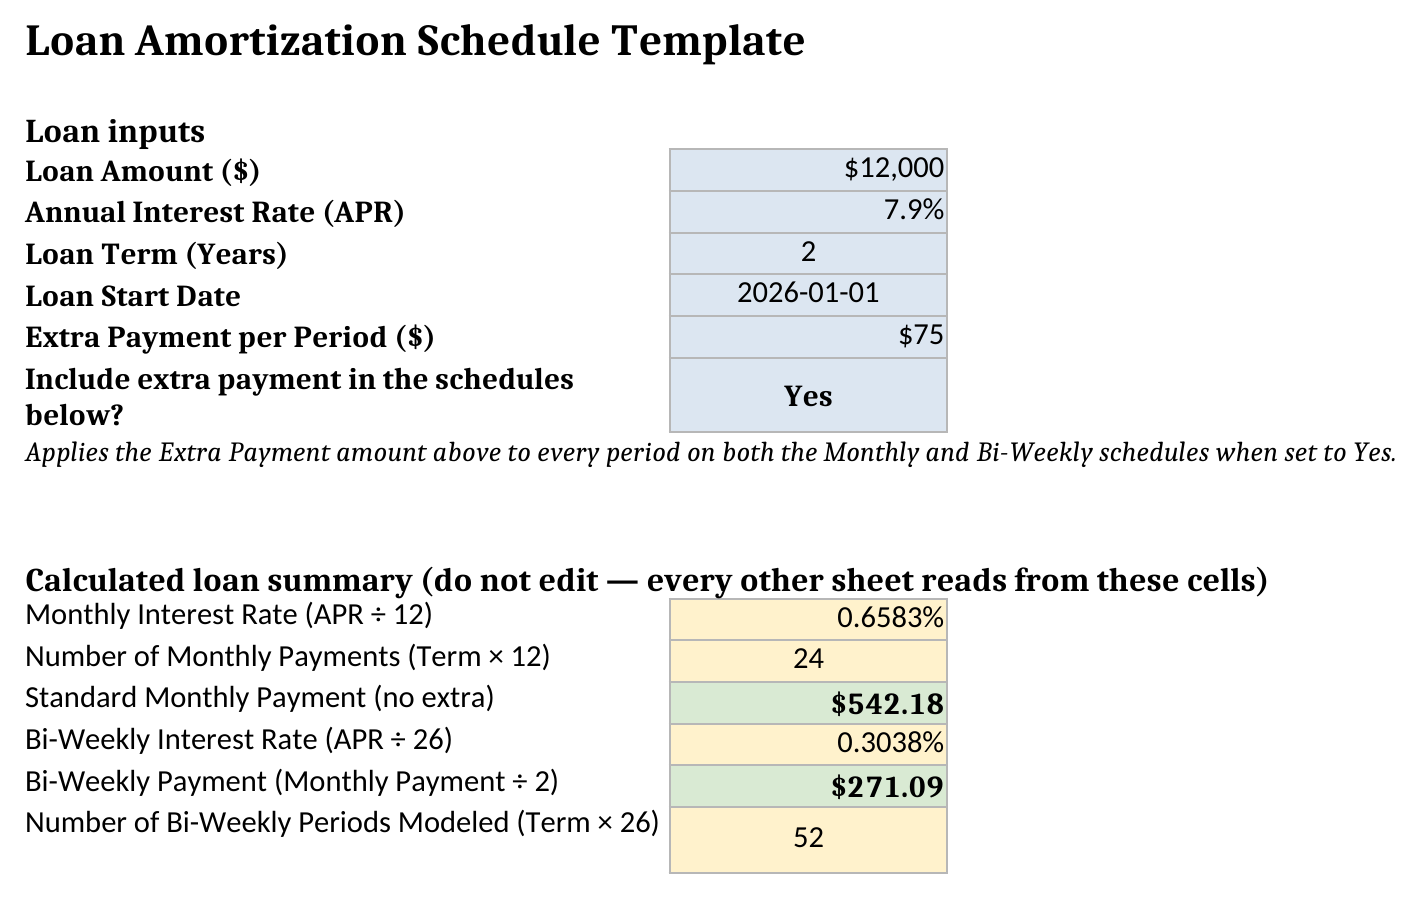
- Inputs — your loan amount, APR, term in years, start date, and extra payment amount, plus a “Calculated loan summary” block that works out the standard monthly payment, the bi-weekly equivalent, and the number of periods each schedule needs.
- Monthly Amortization Schedule — the full month-by-month table: payment number, estimated payment date, beginning balance, interest, scheduled principal, extra payment, total principal, total payment, and running balance.
- Bi-Weekly Amortization Schedule — the same table structure, but paid every 14 days at half the monthly payment amount.
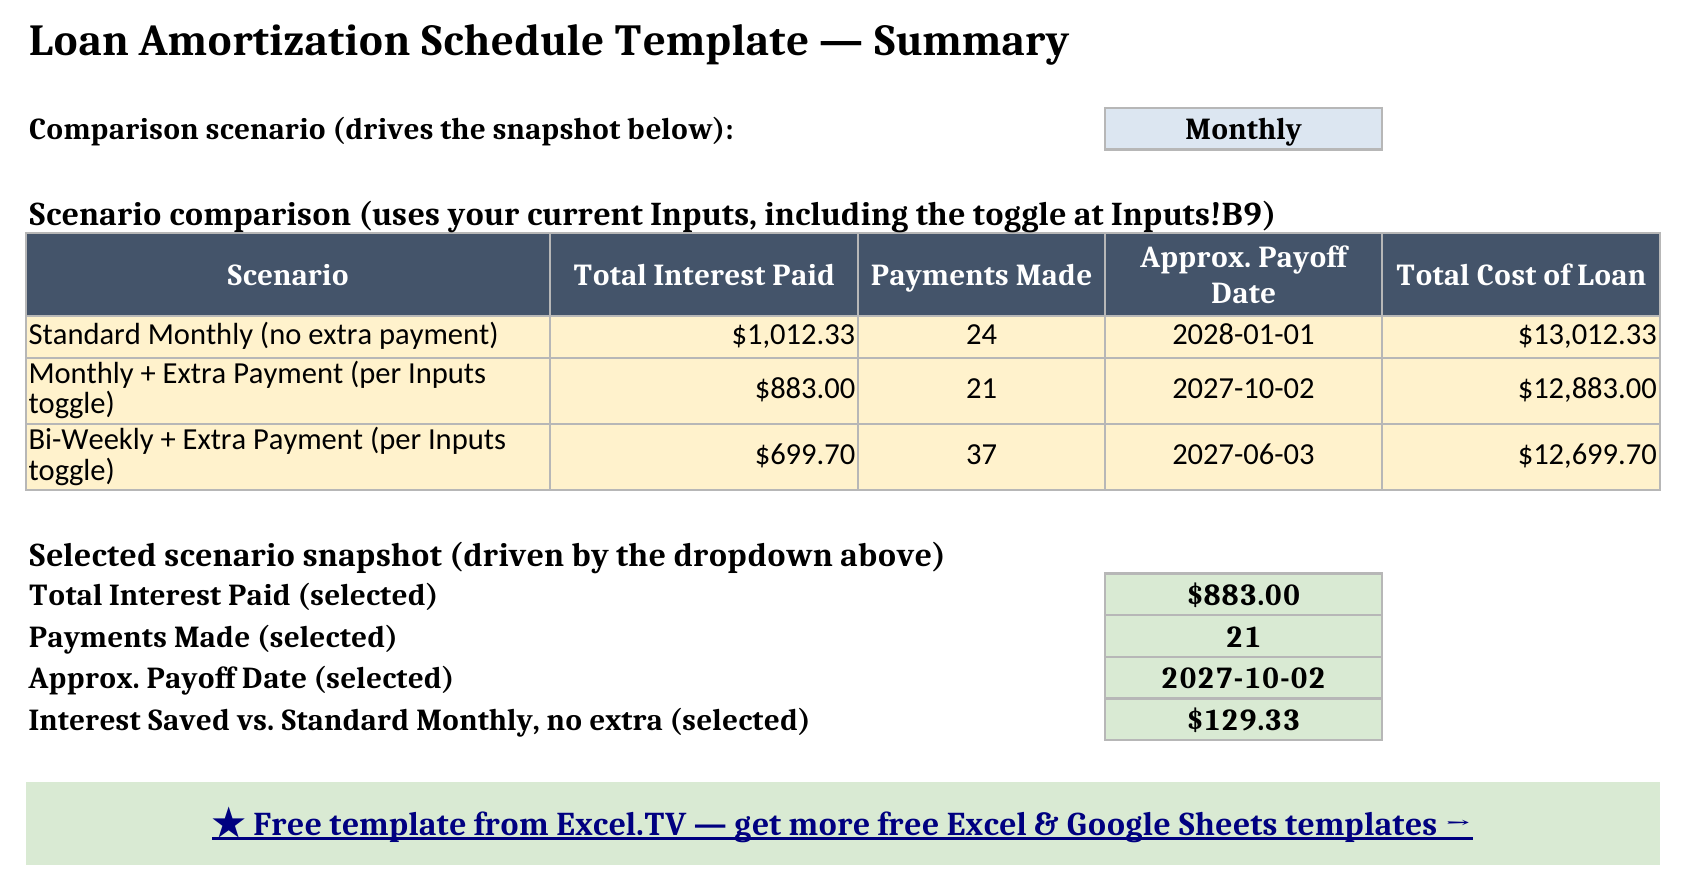
- Summary — a three-row comparison of Standard Monthly (no extra payment), Monthly + Extra Payment, and Bi-Weekly + Extra Payment, plus a scenario selector that pulls whichever one you want into a headline snapshot.
The required inputs are just five values on Inputs: loan amount, APR, term, start date, and extra payment amount (plus the Yes/No toggle that turns the extra payment on or off). The main outputs are each schedule’s Total Interest Paid, Total Payments Made, and Approx. Payoff Date, all rolled up on Summary so you can compare scenarios without flipping between tabs.
How do I set up the loan amortization schedule?
- Open Inputs and replace the sample $12,000 loan at 7.9% APR over a 2-year term with your own numbers, along with your loan’s actual start date.
- Decide whether you want to model an extra payment. Enter a dollar amount in Extra Payment per Period and set Include extra payment in the schedules below? to Yes — or leave it at No to see a plain, full-term payoff.
- Open Monthly Amortization Schedule to see the payment-by-payment breakdown. Nothing on this sheet needs to be typed by hand; every cell is a formula that reads from Inputs.
- Open Bi-Weekly Amortization Schedule to see the same loan paid every 14 days instead of monthly, using the same extra-payment setting.
- Go to Summary, use the scenario selector to flip between Monthly and Bi-Weekly, and read the “Interest Saved” line to see exactly what your extra payment (or your switch to bi-weekly) is worth in dollars.
Because the payment amount is computed with the standard amortization formula — loan amount times rate times a growth factor, divided by that growth factor minus one — rather than a spreadsheet’s built-in PMT function, the exact same formula evaluates identically whether you open this in Excel, Google Sheets, or LibreOffice. No function-name mismatches, no macro security warnings.
How the extra-payment toggle and bi-weekly schedule actually work
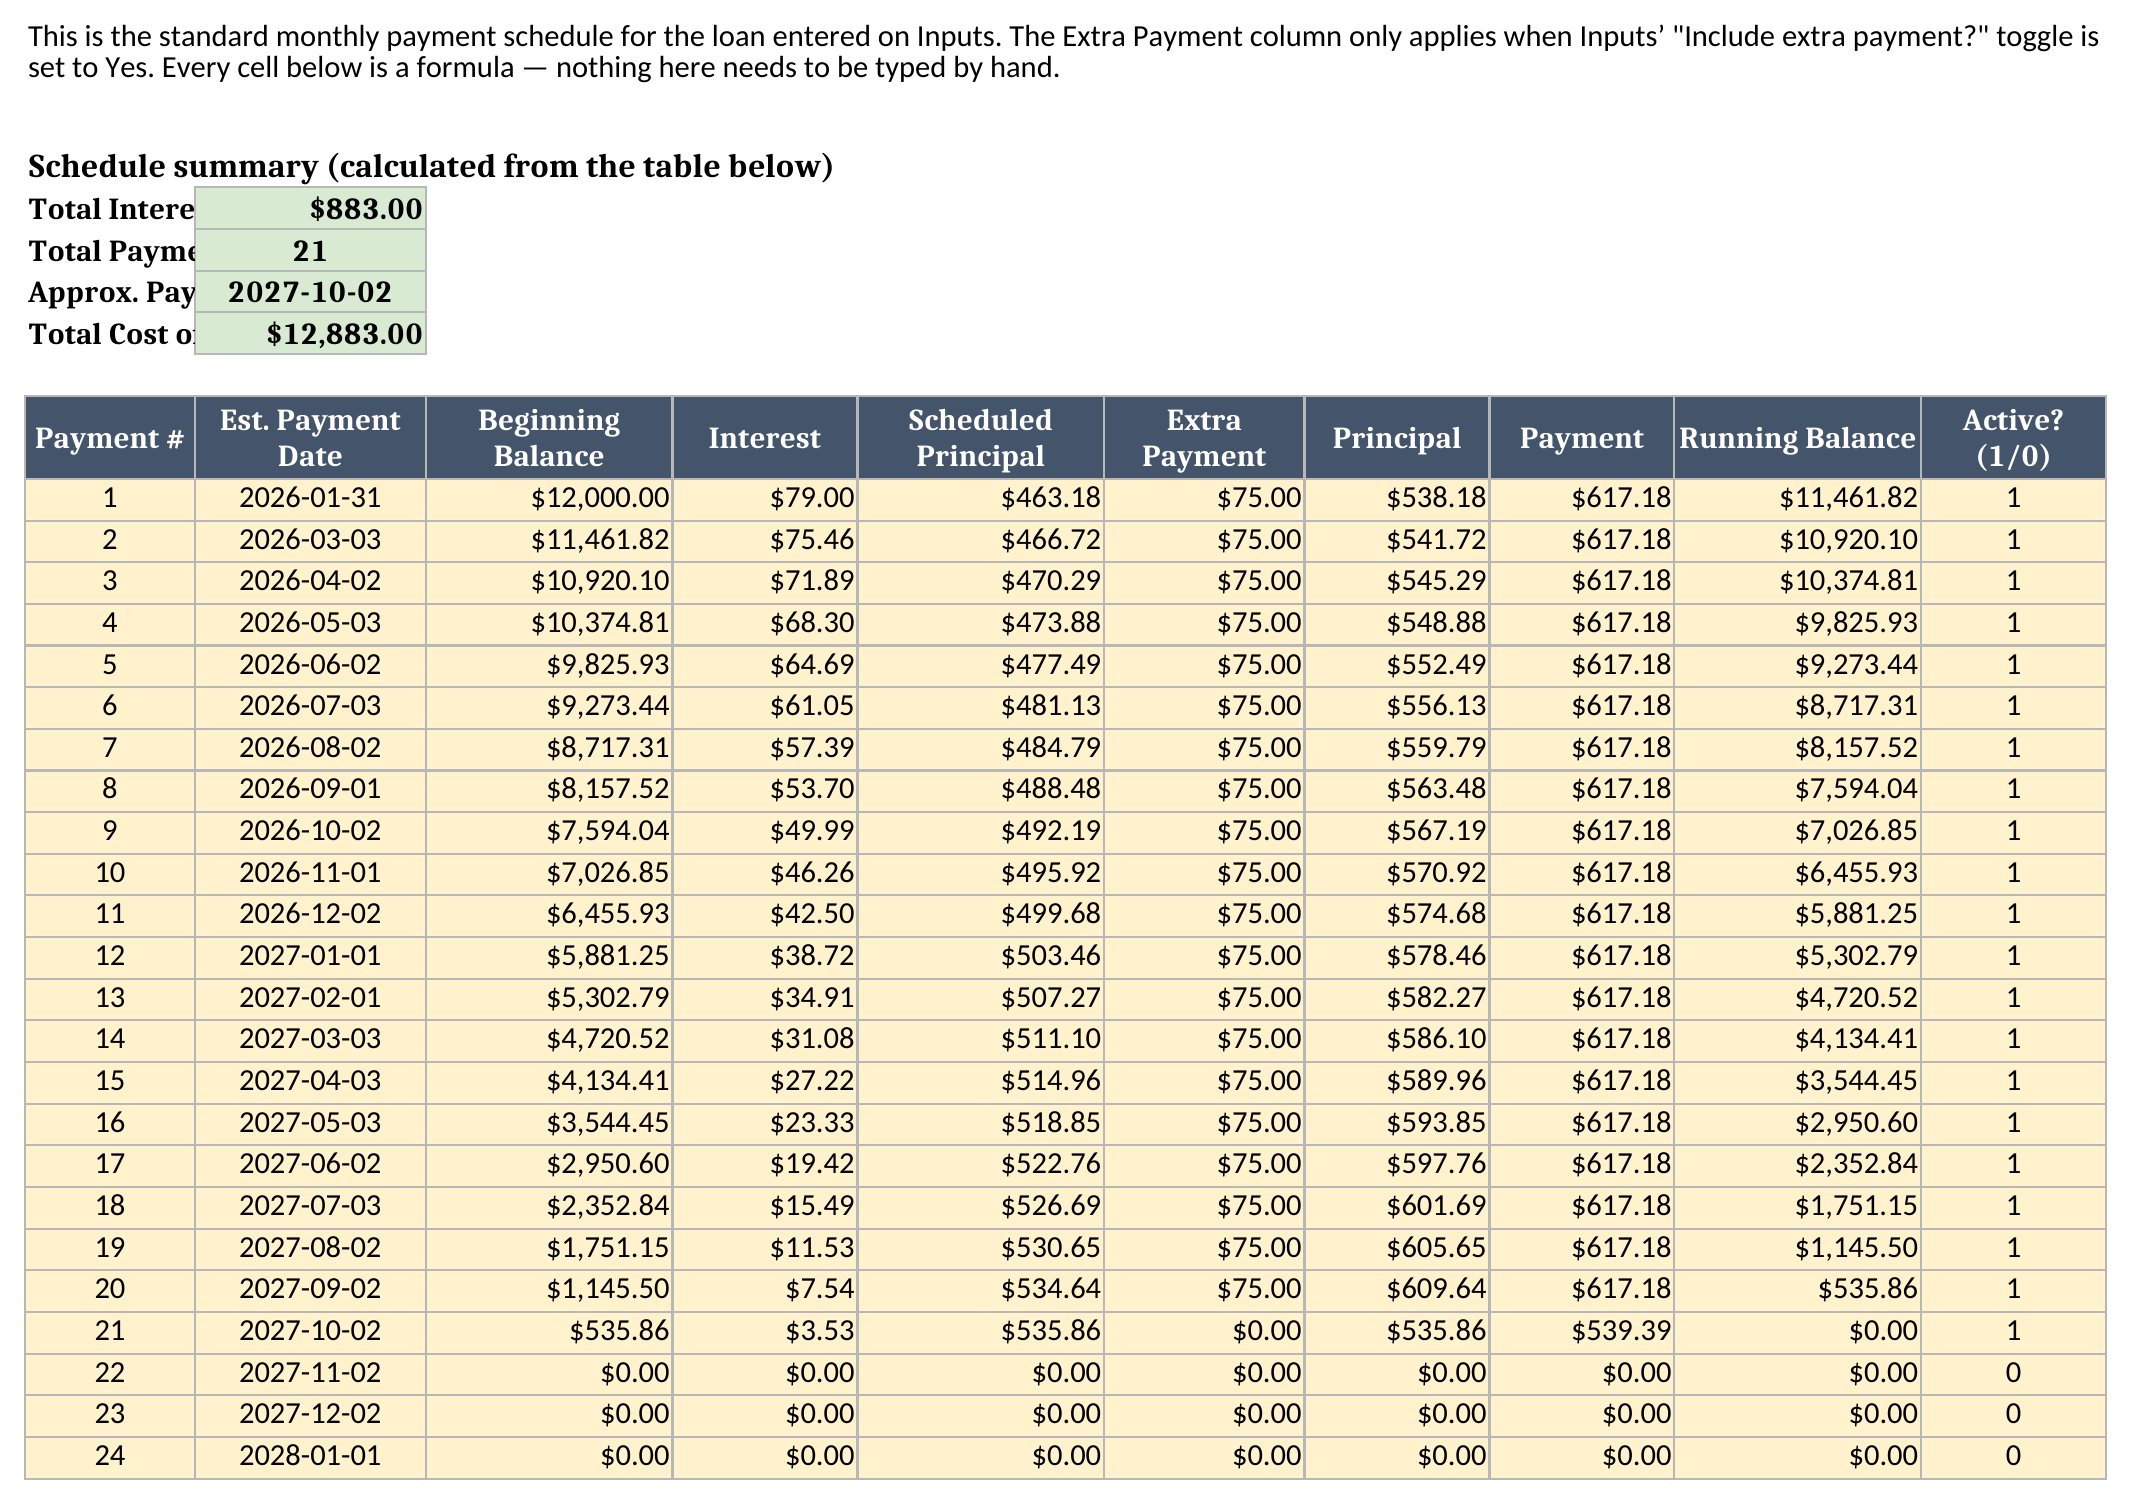
The mechanic I’m proudest of here is how the Extra Payment column behaves once a loan is almost paid off. Instead of just adding a flat $75 to principal every single period — which would eventually push the running balance negative — each row first checks how much principal is actually left after the scheduled payment, then caps the extra amount at whatever’s left. Look at row 21 in the screenshot below: the beginning balance is only $535.86, well under the $75 extra payment amount, so the Extra Payment column drops to $0.00 and the Scheduled Principal column alone ($535.86) clears the loan. That’s why the balance lands on exactly $0.00 instead of drifting negative, and why every row after payoff correctly shows $0.00 across the board rather than a formula error.
The bi-weekly schedule uses a completely separate set of periods — 14 days apart, at exactly half the standard monthly payment — rather than trying to force one table to switch between two different payment frequencies. That’s a deliberate design choice: a 26-payment-per-year schedule and a 12-payment-per-year schedule don’t share a row count, so keeping them as two dedicated sheets (both driven by the same Inputs and the same extra-payment toggle) is far more robust than any single sheet trying to dynamically resize itself. You can see the effect of the accelerated bi-weekly cadence directly in the Summary sheet’s comparison table.
Worked example: a $12,000 loan at 7.9% APR
I built the sample data around a $12,000 personal loan at 7.9% APR over a 2-year term, starting January 1, 2026, with a $75-per-period extra payment toggled on — numbers pulled straight from the workbook after a full formula recalculation:
| Scenario | Total Interest Paid | Payments Made | Approx. Payoff Date | Total Cost of Loan |
|---|---|---|---|---|
| Standard Monthly (no extra payment) | $1,012.33 | 24 | 2028-01-01 | $13,012.33 |
| Monthly + $75 Extra Payment | $883.00 | 21 | 2027-10-02 | $12,883.00 |
| Bi-Weekly + $75 Extra Payment | $699.70 | 37 | 2027-06-03 | $12,699.70 |
The standard monthly payment on this loan works out to $542.18, computed straight from the amortization formula in Inputs — no rounding tricks, no plug numbers. Payment #1 on the Monthly schedule starts with a $12,000.00 beginning balance, splits into $79.00 of interest and $463.18 of scheduled principal, adds the $75.00 extra payment for $538.18 of total principal, and lands on a $617.18 total payment that brings the running balance down to $11,461.82. Carry that forward with the extra payment applied every period, and the loan is fully paid off by payment 21 (October 2, 2027) instead of running the full 24 months — saving $129.33 in interest versus the no-extra-payment baseline.
Switch to the Bi-Weekly schedule with the same $75 extra payment, and the picture improves again: 37 bi-weekly payments (a little over a year and a half) clears the loan by June 3, 2027, at a total interest cost of $699.70 — $312.63 less than the plain monthly schedule and $182.63 less than monthly-plus-extra. That gap is exactly the bi-weekly effect I mentioned above: 26 half-payments a year adds up to more principal paid down annually than 12 full payments, even before you add anything extra on top.
Grab the loan amortization schedule excel workbook if you want to plug in your own loan amount and rate and watch these three scenarios update live.
How do I use this in Google Sheets?
Google Sheets is a first-class destination for this excel amortization schedule template, not an afterthought. Open Google Sheets, choose File > Import > Upload, select the downloaded .xlsx, and pick “Insert new sheet(s).” Every formula in this workbook — SUM, IF, IFERROR, ROUND, and standard arithmetic including the exponent operator used to compute the payment amount — is natively supported in Google Sheets, so nothing needs to be rewritten, and the Yes/No and Monthly/Bi-Weekly dropdown data validation carries over with it.
If you’d rather skip the download-and-import step entirely, use this one-click copy link: make a copy of the Loan Amortization Schedule Template in Google Sheets. Google will prompt you to save it to your own Drive, and from there it behaves identically to the Excel version — same sheets, same formulas, same extra-payment toggle.
If you’re tracking this loan payment inside a broader monthly close instead of on its own, my finance dashboard template is built for that wider budget-vs-actual view; and if the loan in question is financing a specific capital project rather than general cash flow, my construction budget template handles that cost-code-level tracking directly.
How this compares to a basic loan payment calculator
Most “loan calculator” spreadsheets you’ll find online do one thing: plug in a rate, a term, and a loan amount, and spit out a single monthly payment number. That’s useful for a quick estimate, but it can’t answer the follow-up questions that actually change your payoff strategy — how much of payment #14 is interest versus principal, what happens to the schedule if you add $75 a month starting today, or how much bi-weekly payments would actually save versus just guessing. This template keeps the one-line payment estimate (it’s right there on Inputs), but backs it with the full row-by-row schedule and two live payoff scenarios, so you’re comparing real total-interest numbers instead of a rule of thumb.
Limitations to know before you rely on this
A few things are worth knowing before you put a real loan into this:
- The standard monthly payment is computed arithmetically, not with a
PMTfunction. That’s deliberate — it’s what keeps the formula portable and identical across Excel, Google Sheets, and LibreOffice, and it means you can see every step of the calculation rather than trusting a black box. - Payment dates on the Monthly schedule are estimates. They’re calculated using a 30.4368-day average month (labeled “Est.” in the column header), not your lender’s exact statement date. The Bi-Weekly schedule’s dates are exact, since every period is a fixed 14 days apart.
- Both schedules apply the same flat extra-payment dollar amount per period. That means the Bi-Weekly schedule effectively receives more extra-payment dollars per year than Monthly (26 periods instead of 12) — that’s expected, and it’s part of why bi-weekly payoff is faster, not a bug.
- Each schedule is sized to the loan’s original term — 24 monthly rows and 52 bi-weekly rows in the sample data. If extra payments clear the balance early, the remaining rows correctly show $0.00 across every column. If you extend the Loan Term on Inputs, you’ll need to copy the last row’s formulas down to match the new row count on both schedule sheets.
- Interest is rounded to the cent on each row before it’s added to the running total, the same way most real loan servicers round period interest — and the final period’s principal is capped at whatever balance remains so the loan never runs past $0.
I’d rather you know these boundaries going in than discover them mid-payoff-plan. Once you’ve replaced the sample loan with your own numbers and picked a Yes or No on the extra-payment toggle, the rest of the workbook takes care of itself.
Download the loan amortization schedule excel template and start running your own numbers.
