
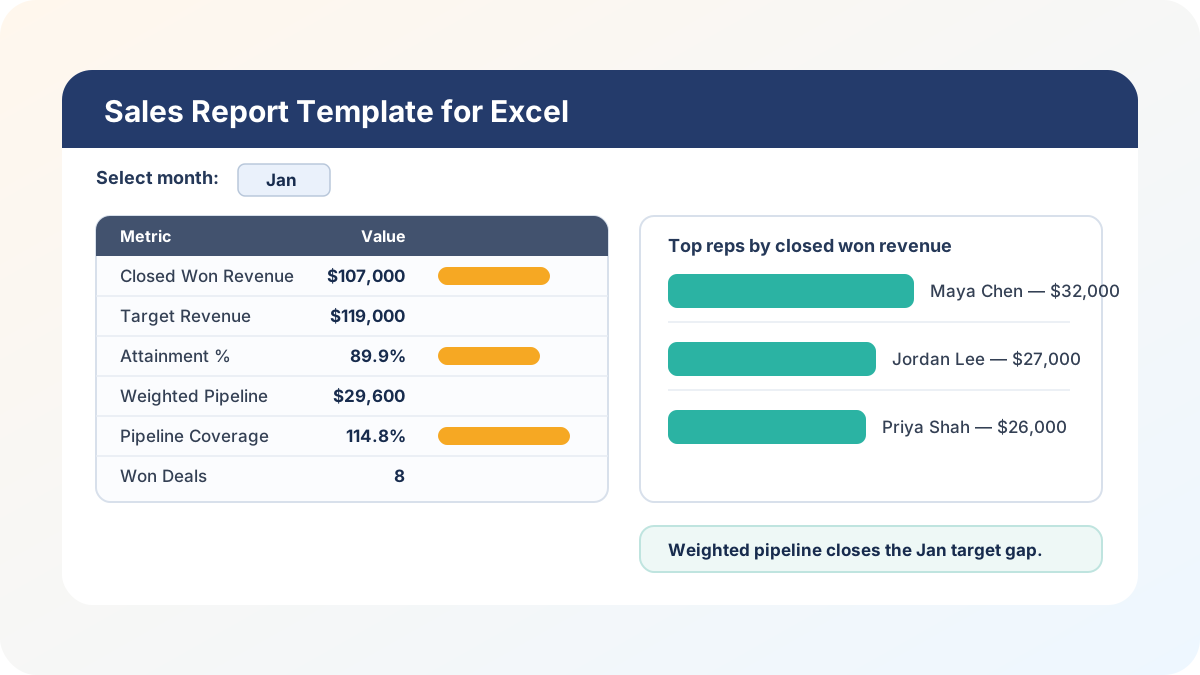
I built this sales report template excel workbook for the kind of weekly or monthly sales meeting where everyone needs the numbers quickly, but nobody wants to spend the first twenty minutes arguing about which tab has the right total. The template gives you one place to enter closed deals, one place to enter monthly targets, one place to enter open pipeline, and one dashboard that summarizes the month you choose.
Download the sales report template excel workbook - it is a plain .xlsx, ungated, no macros, no external data connections, and no sign-up. Open it in Excel, import it into Google Sheets, and replace the synthetic sample data with your own sales data.
Who I built this for
This is for a small sales team, founder-led sales process, or finance/ops person who needs a practical sales dashboard without setting up a business intelligence tool. If you can export deals from a CRM, or if your team is still tracking deals manually, you can use this workbook.
I did not build it as a CRM replacement. It will not send reminders, log calls, or sync automatically with your sales tools. What it does well is the reporting layer: closed won revenue, quota attainment, weighted pipeline, pipeline coverage, won deal count, lost revenue, and top reps for the selected month.
That is the reporting job I see people do by hand all the time. They filter a deal list, copy a few totals into a meeting deck, sort reps manually, and then repeat the same work next week. A spreadsheet can do that cleanup if the inputs are structured correctly.
What is inside the workbook
The workbook has six sheets, in this exact order:
- Instructions - setup notes, clean-room disclosure, Google Sheets notes, and limitations.
- Sales Data - closed won and closed lost deals, one row per deal.
- Targets - rep quota by month, one row per rep/month combination.
- Pipeline - open opportunities with expected month, amount, probability, and weighted pipeline.
- Rep Performance - calculated rep-level metrics for the month selected on the Dashboard.
- Dashboard - the one-page sales dashboard excel template view.
The workbook uses synthetic customer names and synthetic numbers only. There are no vendor references, no copied layouts, no external assets, no macros, and no external workbook or data connections. The formula set is intentionally conservative so the file works in both Excel and Google Sheets: SUM, SUMIFS, IF, IFERROR, INDEX, MATCH, ABS, ROUND, LARGE, and arithmetic.
How to enter closed sales data
Start on Sales Data. This sheet is the closed-deal log. Each row has a Deal ID, Month, Rep, Region, Product, Customer, Amount, and Status. Status is either Won or Lost.
The important thing is that Amount should be entered for both won and lost deals. If a deal was lost at $7,000, keep the $7,000 on the row and mark the status Lost. The workbook uses helper columns to split the value into Won Revenue and Lost Revenue. That gives the dashboard a real lost-revenue number instead of ignoring lost deals completely.
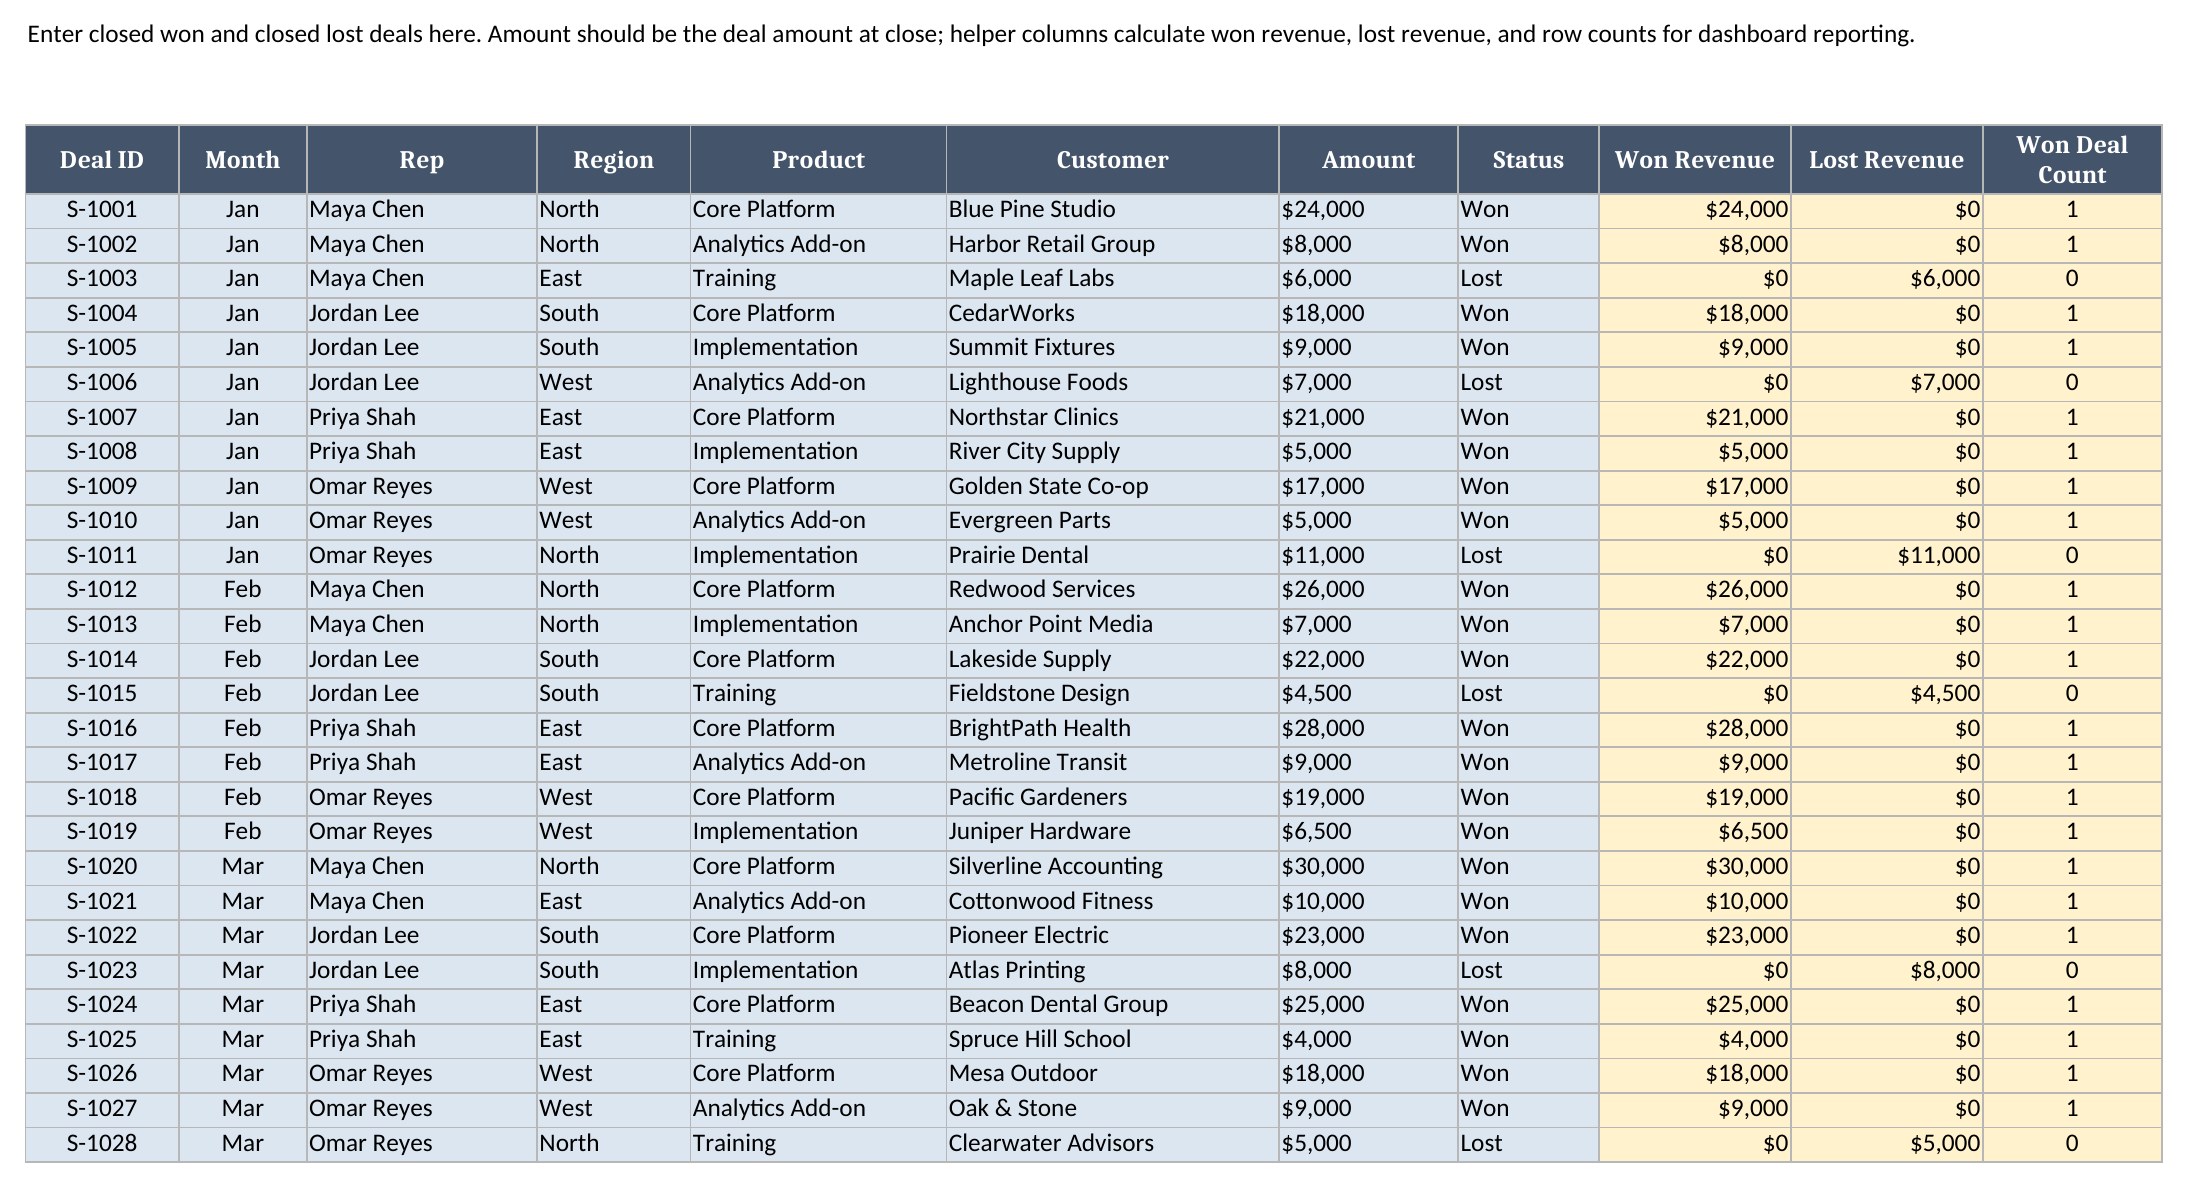
The input columns are blue. The calculated helper columns are yellow. That color pattern matters because it tells you where you can type safely. If you overwrite the helper formulas, the dashboard totals will still look formatted, but the numbers will no longer be reliable.
How to set monthly targets
The Targets sheet is deliberately normalized instead of spread across a wide table. Each row is one rep and one month. For example, Maya Chen has separate rows for Jan, Feb, and Mar.
That structure makes the formulas easier to maintain. Rep Performance can use SUMIFS to pull the target for a selected rep and selected month. It also means duplicate target rows are not hidden. If you accidentally enter Maya Chen twice for Jan, the workbook will add both rows together. That is not a bug in SUMIFS; it is a signal to check your input table.
If you add a new rep, add that rep to Targets, add the rep to the Rep Performance sheet, and use the same spelling everywhere. This template is not using Power Query or a dynamic array spill to build a rep list automatically, because I wanted the workbook to stay simple and portable.
How weighted pipeline works
The Pipeline sheet is for open opportunities. It has Expected Month, Rep, Region, Product, Prospect, Stage, Amount, Probability, Weighted Pipeline, and Open Deal Count.
Weighted Pipeline is plain arithmetic: Amount times Probability. A $20,000 opportunity at 60% probability contributes $12,000 of weighted pipeline. That number is not booked revenue. It is a planning estimate that helps answer a different question: if the team has already closed $107,000 against a $119,000 target, is there enough realistic pipeline left to cover the gap?
I like separating closed revenue and weighted pipeline because it prevents the dashboard from pretending open opportunities are already won. The Dashboard shows Closed Won Revenue on its own line, Weighted Pipeline on its own line, and Pipeline Coverage as (Closed Won Revenue + Weighted Pipeline) / Target Revenue.
The Rep Performance sheet is the engine
The Rep Performance sheet is where the workbook turns raw rows into rep-level metrics. It reads the selected month from the Dashboard, then calculates each rep’s closed won revenue, target revenue, attainment percentage, weighted pipeline, pipeline coverage, gap to target, won deals, lost revenue, and status.
The status column is intentionally simple. If a rep is already at or above target, the status is At/Above Target. If the rep is below target but pipeline coverage is at least 120%, the status is Pipeline Helps. Otherwise, the status is Needs Pipeline.

That status is not a sales management philosophy in a cell. It is just a practical flag. I want the workbook to tell me where I should look next. A rep at 91.4% attainment with enough near-term pipeline is a different conversation from a rep at 75% attainment with no weighted pipeline behind the number.
Worked example using the recalculated workbook
The workbook opens with the Dashboard set to January. I ran the workbook through the repository’s LibreOffice headless recalculation workflow and used those recalculated values here.
For January, the Dashboard shows:
| Metric | Recalculated value |
|---|---|
| Closed Won Revenue | $107,000 |
| Target Revenue | $119,000 |
| Attainment | 89.9% |
| Weighted Pipeline | $29,600 |
| Pipeline Coverage | 114.8% |
| Won Deals | 8 |
| Lost Revenue | $24,000 |
The top three reps for January are:
| Rank | Rep | Closed Won Revenue | Target | Attainment | Status |
|---|---|---|---|---|---|
| 1 | Maya Chen | $32,000 | $35,000 | 91.4% | Needs Pipeline |
| 2 | Jordan Lee | $27,000 | $30,000 | 90.0% | Pipeline Helps |
| 3 | Priya Shah | $26,000 | $28,000 | 92.9% | Needs Pipeline |
Here is how I read that dashboard. The team is $12,000 short of the January target before open pipeline is considered. Weighted pipeline is $29,600, so the team has enough weighted pipeline to cover the gap in theory, but the coverage ratio is 114.8%, not 150% or 200%. That is why I would not call the month safe. I would use the rep detail to ask which January opportunities are truly likely to close and which ones need manager help.
Maya is ranked first at $32,000 closed won revenue against a $35,000 target. Her January weighted pipeline is $9,600, so her personal coverage is 118.9%. That is close, but still below the workbook’s 120% status threshold. Jordan is at $27,000 against $30,000 with $9,600 of weighted pipeline, which pushes him to 122.0% coverage and changes his status to Pipeline Helps. Priya is at $26,000 against $28,000 with $5,000 weighted pipeline. Omar is not in the top three for closed won revenue, but he still contributes $22,000 closed won and $5,400 weighted pipeline.
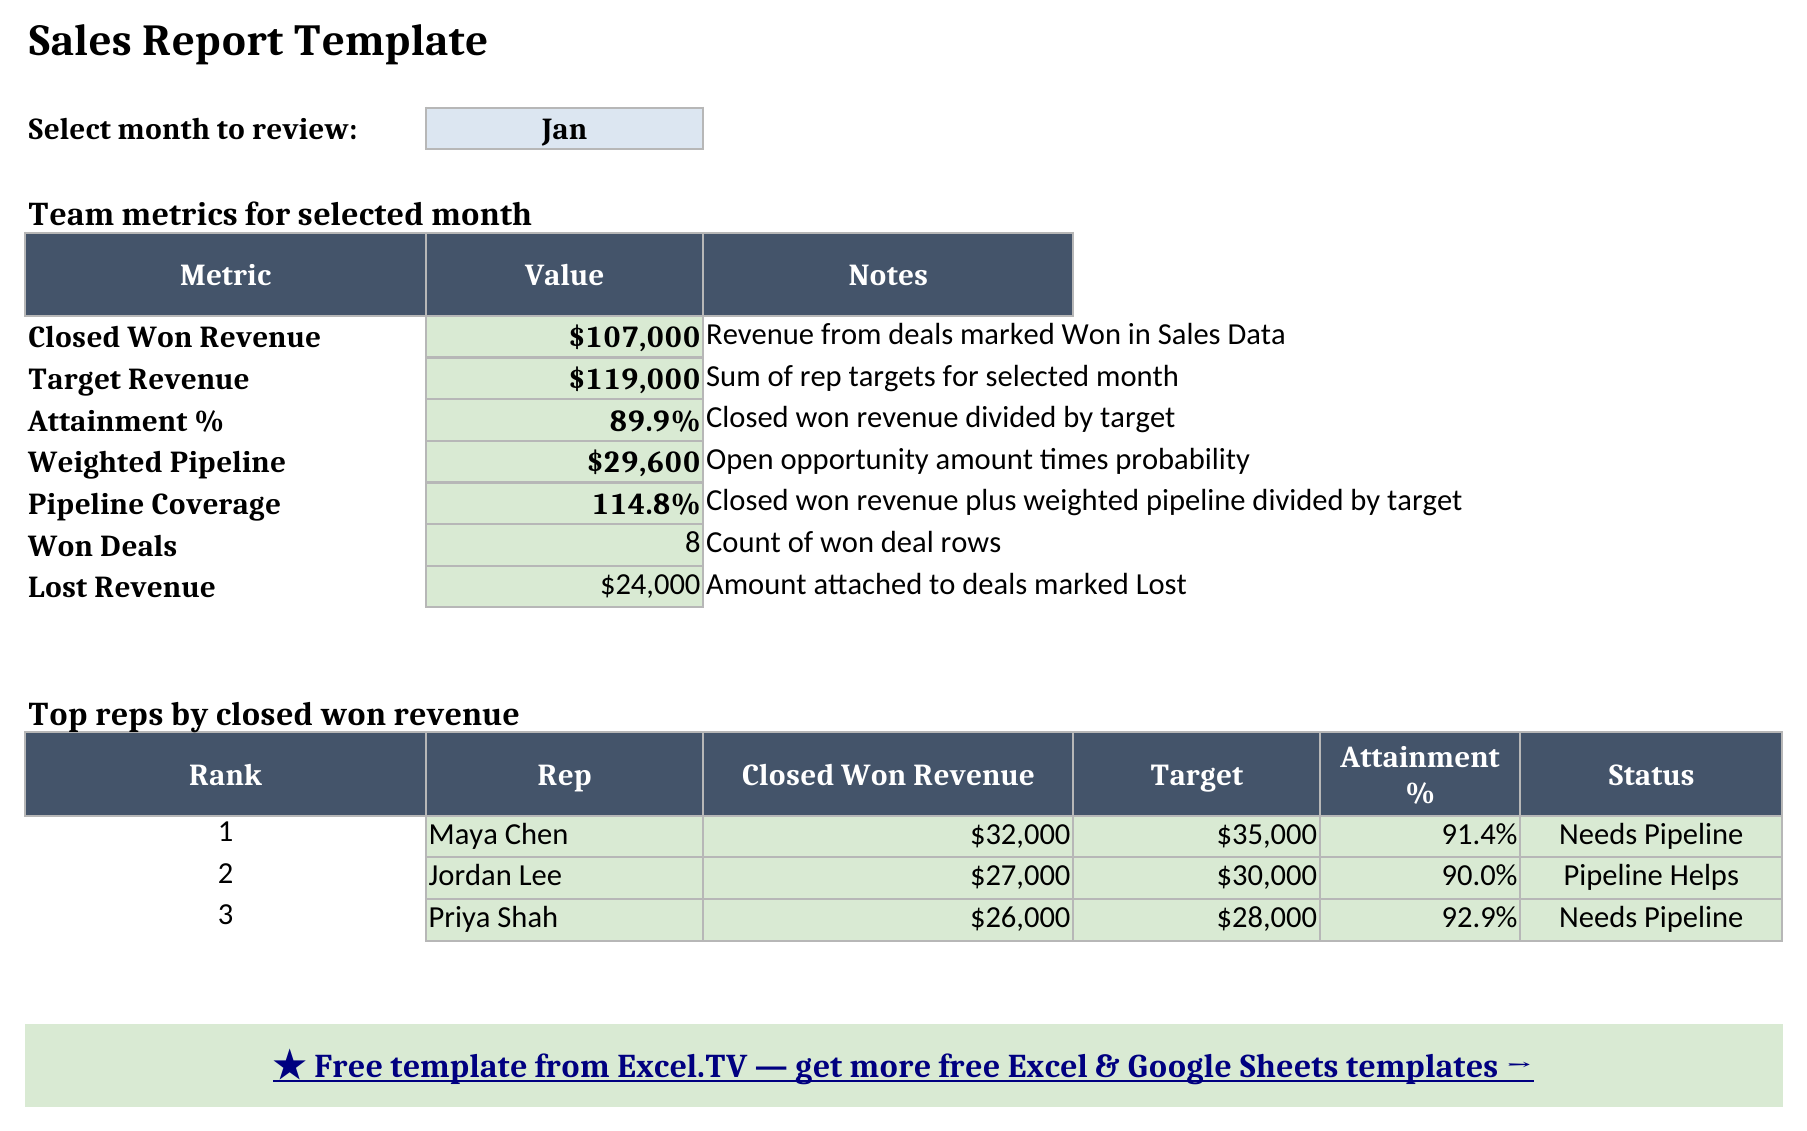
This is the kind of worked example I want in a sales tracker. It is not just a pretty KPI card. The numbers tell you what meeting to run: review the largest open January opportunities, check whether target gaps are real or timing-related, and separate closed performance from forecasted pipeline.
How to use it as a Google Sheets sales tracker template
I did not publish a live Google Sheet copy link for this task because no supported Google Drive credentials are available in this worktree. I am not going to fabricate a /copy URL.
You can still use the workbook as a google sheets sales tracker template with these steps:
- Download the workbook: sales-report-template.xlsx.
- Open Google Sheets.
- Choose File > Import > Upload.
- Select the downloaded
.xlsxfile. - Choose Insert new sheet(s) or create a new spreadsheet from the upload.
- Check the Dashboard month selector and the dropdowns on the input sheets.
- Replace the synthetic rows with your own deals, targets, and pipeline.
The formulas do not need to be rewritten for Google Sheets. The dropdown validations also import cleanly because they are basic list validations. If your team wants a shared working copy, import the file once, rename it, and then use Google Sheets sharing permissions from your own Drive.
Limitations before you rely on it
There are a few limitations I want you to know before you put real sales numbers in the workbook.
- Rep names must match exactly across sheets.
Maya ChenandMaya C.are different reps toSUMIFS. - Month values must match the dropdown values. The sample workbook uses
Jan,Feb, andMar. - The top-three ranking uses
LARGEplusMATCH. If two reps tie exactly, the first matching rep is returned. - Weighted pipeline is a planning estimate. It is not a forecast commitment and it is not closed revenue.
- The workbook is static. It does not sync with a CRM, refresh data, or enforce your sales process.
- If you add more rows than the sample model includes, extend the formulas and referenced ranges before trusting the dashboard.
That last point is the big one. A spreadsheet template is only useful if the input structure stays clean. Keep one closed deal per row, one target per rep/month row, and one open opportunity per pipeline row, and the dashboard will stay easy to audit.
If you want a more general customer-and-opportunity tracker before you get to dashboard reporting, my Excel CRM template is the better starting point. If you are building the reporting side now, use this sales report template as the monthly summary layer and keep the inputs disciplined.
