
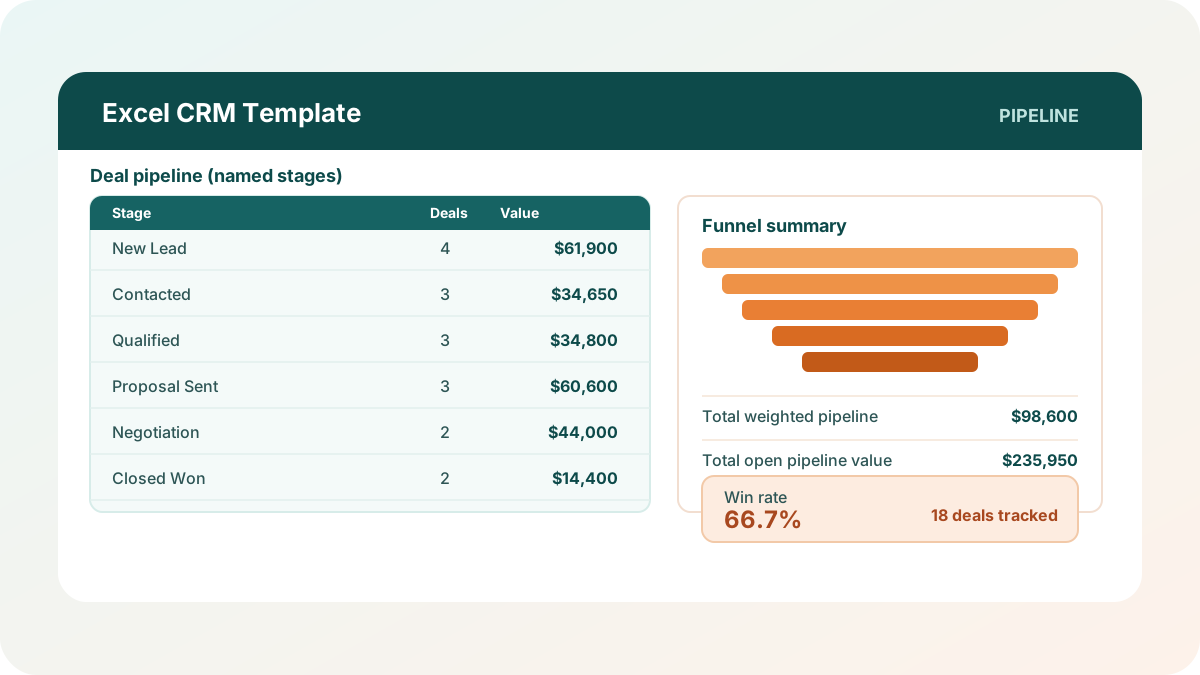
Every small sales team I’ve talked to eventually hits the same fork in the road: sticky notes and a spreadsheet-of-one stop working the day a second person starts selling, but a full CRM subscription feels like overkill for a team that’s tracking eighteen deals, not eighteen hundred. This excel CRM template is built for that exact gap — a Contacts list, a deal Pipeline with named stages, an Activity Log, and a Funnel Summary that tells you, at a glance, how much pipeline you actually have and how likely it is to close.
Download the excel CRM template — it’s a plain .xlsx, no macros, no external data connections, and no sign-up. Open it in Excel or Google Sheets and start replacing the sample contacts and deals with your own.
Who is this template for?
I built this for solo founders, small sales teams, consultants, and agencies who are past tracking deals in their head but aren’t ready to pay for — or configure — a dedicated CRM platform. If you’re the kind of operator who wants to see exactly how a pipeline stage rolls up into a dollar figure, rather than trusting a black-box dashboard, this workbook is also a reasonably approachable teaching example: it pairs INDEX/MATCH lookups across three sheets with COUNTIF/SUMIF/SUMIFS aggregation to build a funnel summary from scratch.
It is not a replacement for Salesforce, HubSpot, or Pipedrive once you have real volume. There’s no automatic email sync, no reminders, and no multi-user permissions — every person editing this file trusts every other person not to overwrite a row. If that’s already a problem for your team, you’ve outgrown a spreadsheet CRM, and I say that plainly in the limitations section below rather than pretending this template scales past what a spreadsheet honestly can.
What’s in the workbook, sheet by sheet
The workbook ships with five sheets, in this order:
- Instructions — a setup guide plus a clean-room disclosure: every formula, layout, and sample figure in this workbook was authored from scratch for Excel.TV. No vendor CRM, template, or dataset was downloaded, inspected, or adapted to build it.
- Contacts — the master list of people and companies you deal with: name, company, email, phone, lead source, owner, and the date they became a contact.
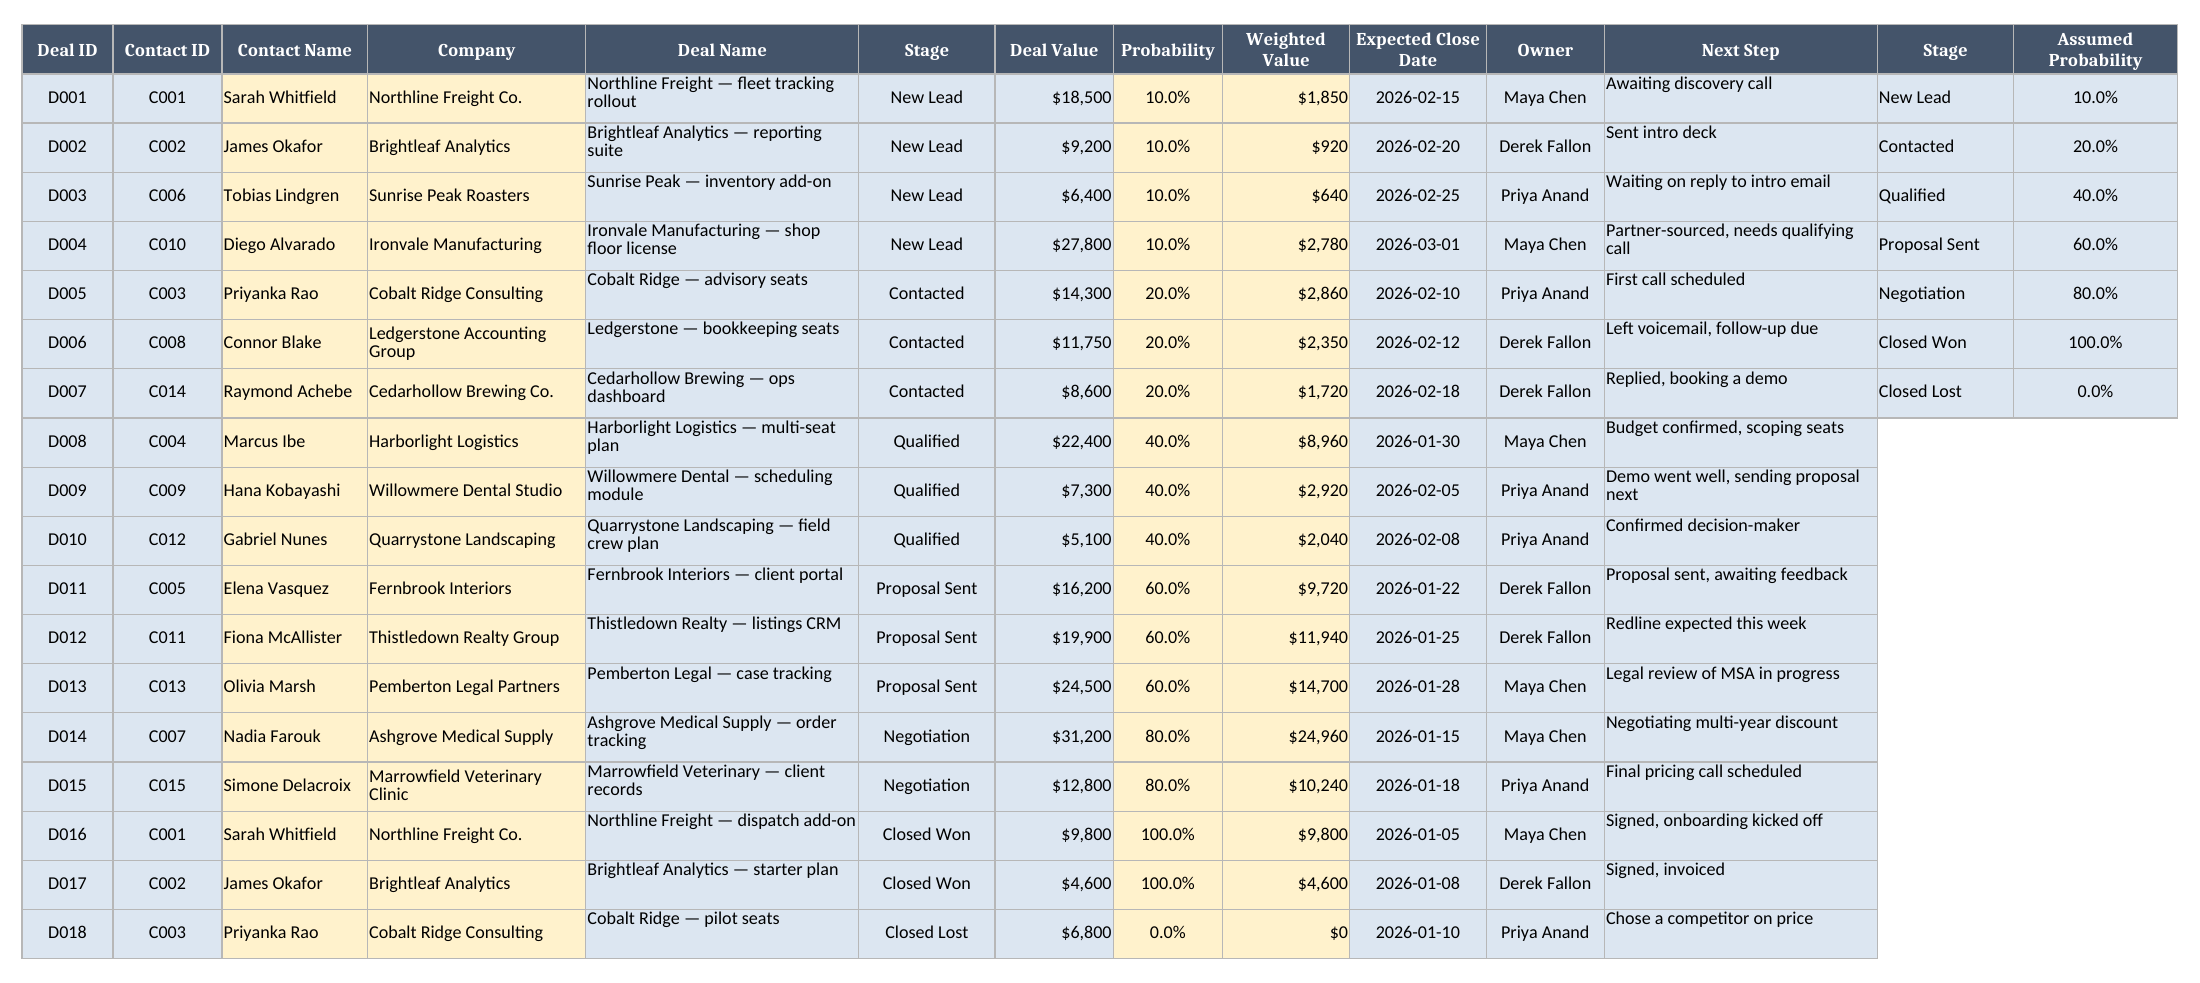
- Pipeline — every deal, one per row: a lookup-driven Contact Name and Company, Deal Name, Stage (a dropdown of seven named stages), Deal Value, an assumed close Probability, the resulting Weighted Value, Expected Close Date, Owner, and a Next Step note. A small stage-probability reference table lives in columns M:N of this same sheet.
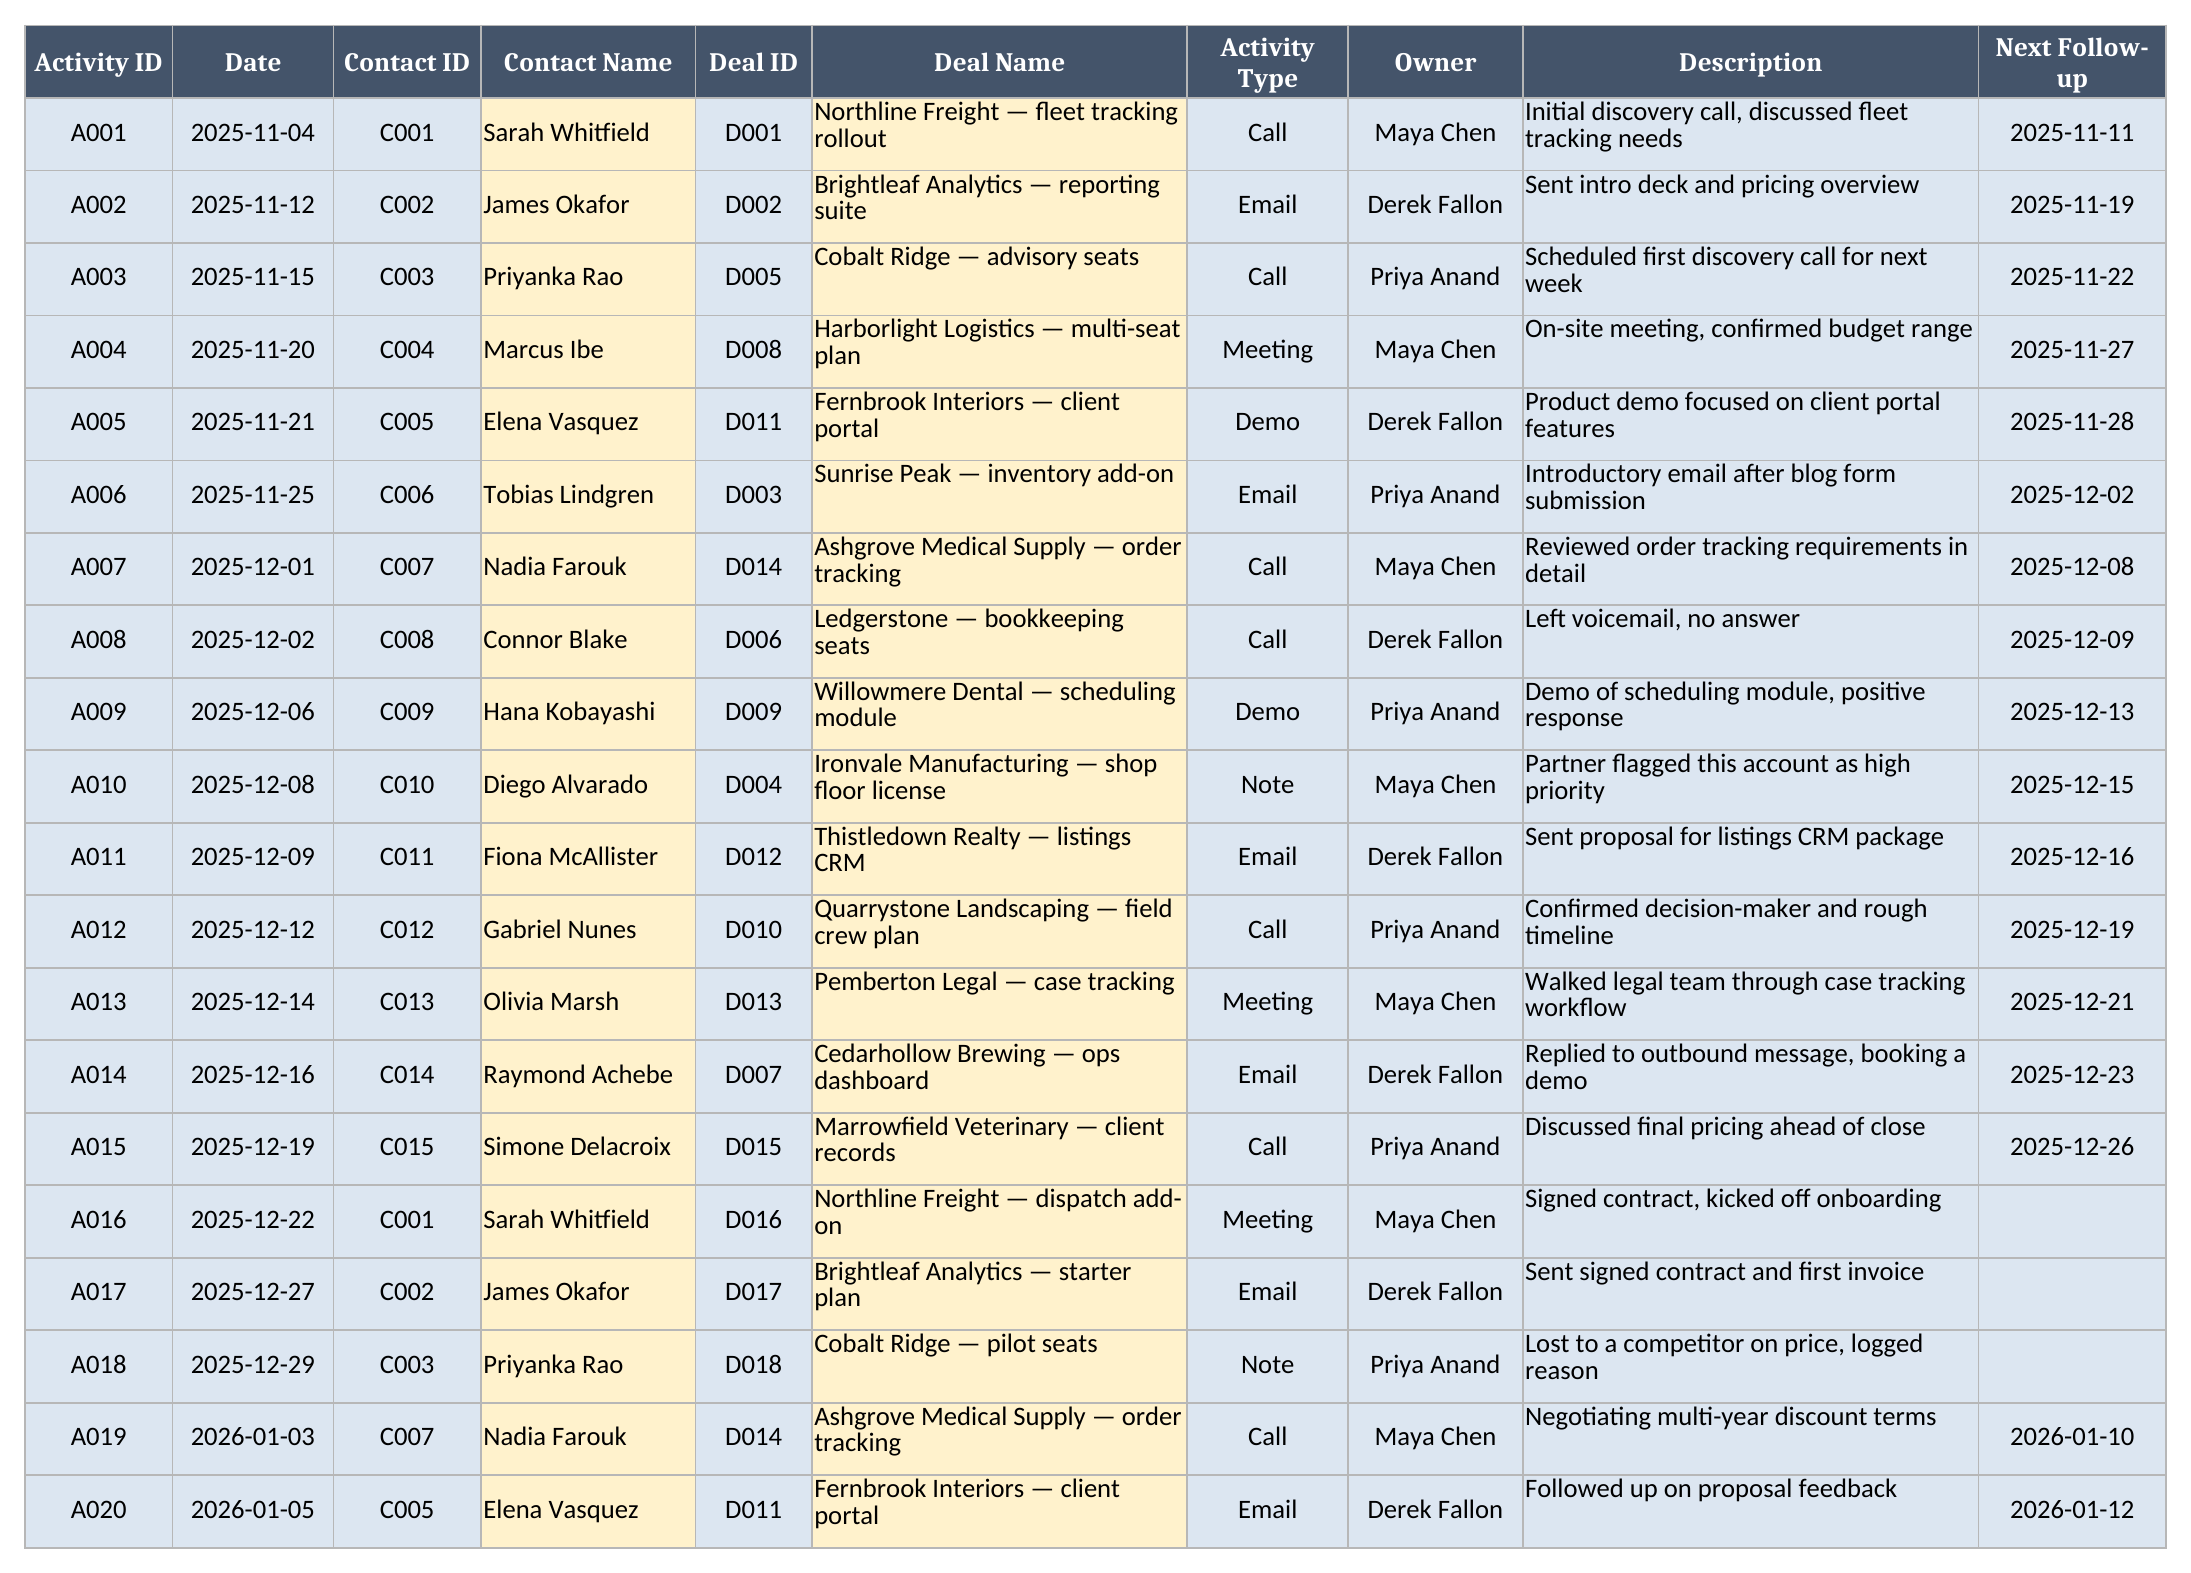
- Activity Log — a chronological record of every call, email, meeting, note, or demo, each row looking up the contact name and (if relevant) the deal name automatically.
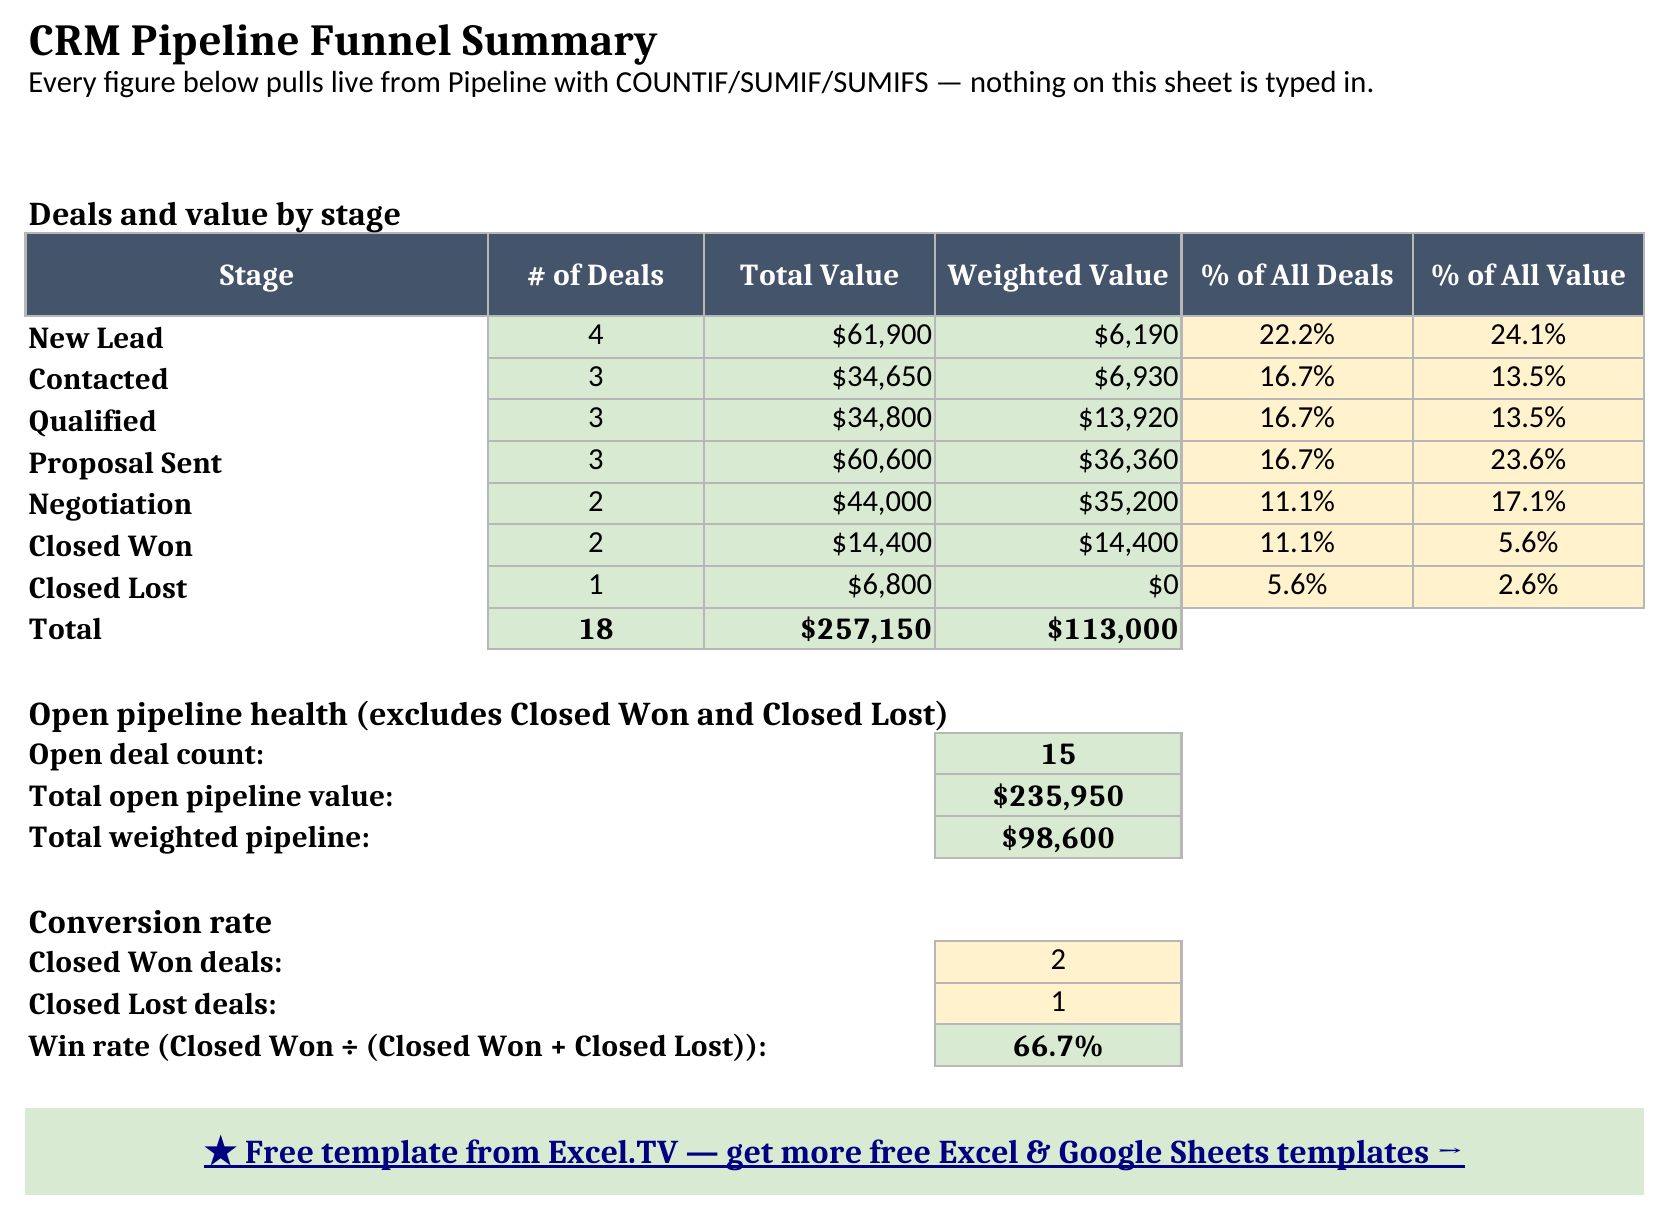
- Funnel Summary — the one-page rollup: deals and value by stage, total open pipeline value, total weighted pipeline, and a win-rate conversion figure.
The required inputs are contact details on Contacts; Contact ID, Deal Name, Stage, Deal Value, Expected Close Date, and Owner on Pipeline; and the activity details on Activity Log. The main outputs are Weighted Value on Pipeline, plus every stage’s deal count, total value, and weighted value, the open pipeline totals, and win rate on Funnel Summary — all of which recalculate the moment you change an input cell.
How do I set up the excel CRM template?
- Open Contacts and replace the sample list with your own — keep each Contact ID unique, since both Pipeline and Activity Log key their lookups off it.
- Open Pipeline and add one row per deal: Contact ID, Deal Name, Stage (choose from the dropdown), Deal Value, Expected Close Date, Owner, and Next Step. Don’t type into Contact Name, Company, Probability, or Weighted Value — those four are formulas.
- As a deal moves forward, update its Stage cell. Probability and Weighted Value recalculate immediately from the stage-probability table on the right side of the same sheet.
- Open Activity Log and add a row every time you make a call, send an email, hold a meeting, or log a note. Enter the Contact ID, and if the activity relates to a specific deal, the Deal ID — Contact Name and Deal Name fill in on their own.
- Open Funnel Summary to see deals and value broken down by stage, total open pipeline value, weighted pipeline, and win rate. Nothing on this sheet is typed in — every cell is a formula reading from Pipeline.
How the stage-probability lookup and weighted pipeline actually work
The mechanic that makes this template more than a glorified deal list is the stage-probability lookup. Instead of typing a probability by hand on every deal — which drifts the moment two people disagree how likely a “Qualified” deal really is — each deal’s Stage cell drives an INDEX/MATCH against a seven-row reference table in columns M:N of the Pipeline sheet: New Lead at 10%, Contacted at 20%, Qualified at 40%, Proposal Sent at 60%, Negotiation at 80%, Closed Won at 100%, Closed Lost at 0%. Change a deal’s stage and its Probability cell updates on its own, reading the same table everyone else reads. Weighted Value is then just =Deal Value*Probability — a $22,400 deal at Qualified (40%) is worth $8,960 weighted, a $31,200 deal in Negotiation (80%) is worth $24,960, and so on down every row.
Funnel Summary takes that a step further with SUMIF and SUMIFS. Each stage’s row uses =SUMIF(Pipeline!Stage,"<stage>",Pipeline!DealValue) to get that stage’s total value and the same pattern against the Weighted Value column to get that stage’s weighted contribution. The Open pipeline health block below the stage table uses a two-condition SUMIFS — criteria "<>Closed Won" and criteria "<>Closed Lost" stacked on the same range — to total everything still in motion, which is the number that actually matters for forecasting: don’t count a deal you’ve already won or already lost in the pipeline you’re still chasing.
Worked example
Here’s the sample pipeline in the template — 18 deals recalculated end to end:
| Stage | # of Deals | Total Value | Weighted Value |
|---|---|---|---|
| New Lead | 4 | $61,900 | $6,190 |
| Contacted | 3 | $34,650 | $6,930 |
| Qualified | 3 | $34,800 | $13,920 |
| Proposal Sent | 3 | $60,600 | $36,360 |
| Negotiation | 2 | $44,000 | $35,200 |
| Closed Won | 2 | $14,400 | $14,400 |
| Closed Lost | 1 | $6,800 | $0 |
| Total | 18 | $257,150 | $113,000 |
| Metric | Value |
|---|---|
| Total open pipeline value (excludes Closed Won/Lost) | $235,950 |
| Total weighted pipeline (excludes Closed Won/Lost) | $98,600 |
| Closed Won deals | 2 |
| Closed Lost deals | 1 |
| Win rate (Closed Won ÷ (Closed Won + Closed Lost)) | 66.7% |
Every number above came straight out of the workbook after a full formula recalculation — nothing was typed in or rounded by hand for this article. Notice that Closed Lost’s Weighted Value is $0 (its assumed probability is 0%, by design — a lost deal contributes nothing to a forward-looking forecast), and that the $98,600 weighted pipeline figure is meaningfully smaller than the $235,950 open pipeline value, which is exactly the gap a raw pipeline total hides and a weighted figure is supposed to expose.
How does the activity log tie into all of this?
Activity Log is the thinnest sheet in the workbook by design, but it’s doing more than logging notes. Every row’s Contact Name and Deal Name columns are INDEX/MATCH formulas — Contact Name looks up against Contacts by Contact ID, Deal Name looks up against Pipeline by Deal ID — wrapped in IFERROR so a typo or a not-yet-linked deal shows a clear “(no linked deal)” instead of a #N/A error. That means as a deal moves through the pipeline, its entire activity history stays attached without you ever retyping a contact or deal name; you just enter IDs, and the readable text follows.
How do I use this in Google Sheets?
Google Sheets is a first-class destination for this template, not an afterthought. Open Google Sheets, choose File > Import > Upload, select the downloaded .xlsx, and pick “Insert new sheet(s).” Every formula in this workbook — SUM, SUMIF, SUMIFS, COUNTIF, IF, IFERROR, INDEX, and MATCH — is natively supported in Google Sheets, so nothing needs to be rewritten, and the Stage, Lead Source, and Activity Type dropdowns’ data validation carries over with it.
If you’d rather skip the download-and-import step entirely, use this one-click copy link: make a copy of the Excel CRM Template in Google Sheets. Google will prompt you to save it to your own Drive, and from there it behaves identically to the Excel version — same sheets, same formulas, same stage-probability lookup.
How this differs from a generic CRM template
Most free CRM templates give you a contact list and a stage column and stop there — no weighted pipeline, no rollup, no honest accounting of what a “50% probability deal” is worth in aggregate. This one is built around two things a spreadsheet CRM should be good at: a single stage-probability table that drives every deal’s weighted value consistently (change the assumption once, every deal updates), and a Funnel Summary that separates “everything in the pipeline” from “everything still open” — a distinction a lot of homemade trackers get wrong by lumping closed deals in with active ones.
If your CRM data eventually needs to feed a monthly numbers review rather than just a sales view, my finance dashboard excel template picks up where this leaves off, turning actuals and budget into a one-page variance view. And if you bill the deals this pipeline closes, my invoice template is built for exactly that next step — line items, discount, tax, and a running invoice log.
Limitations to know before you rely on this
A few things worth knowing before you put a real sales team’s pipeline in here:
- This is a snapshot pipeline, not a stage-history tracker. Funnel Summary shows how many deals sit in each stage right now, not how many deals have ever passed through a stage — so it can’t calculate a true stage-to-stage conversion rate (what % of “Contacted” deals eventually become “Qualified”). Win rate (Closed Won ÷ Closed Won + Closed Lost) is the one true conversion figure this workbook computes, because winning and losing are permanent, unlike moving between open stages.
- Stage probability is a single assumed percentage, not a learned one. The 10%–100% ladder is a reasonable starting point, not a number derived from your team’s actual historical close rates by stage — recalibrate it once you have enough closed deals to know your real numbers.
- Contact IDs and Deal IDs must stay unique. Pipeline and Activity Log look up names by ID with INDEX/MATCH, and a duplicated or missing ID returns the IFERROR fallback text instead of a real name.
- No multi-user permissions, sync, or reminders. Every person editing this file can edit every row, and nothing pings anyone about a stale follow-up date. If your team has outgrown trusting each other not to overwrite a row, that’s the signal it’s time to pay for a CRM platform, not a sign this template is broken.
- No macros, no external connections. Everything here is a native formula. That’s deliberate — it’s what keeps the workbook portable between Excel and Google Sheets with zero substitutions.
I’d rather you know these going in than discover them the first time a deal falls through a gap this template can’t catch. Once the stage-probability lookup and the ID-uniqueness habit are second nature, the rest takes care of itself.
Download the excel CRM template and start replacing the sample contacts and deals with your own — the stage lookup, the weighted pipeline math, and the funnel summary will all follow.
