
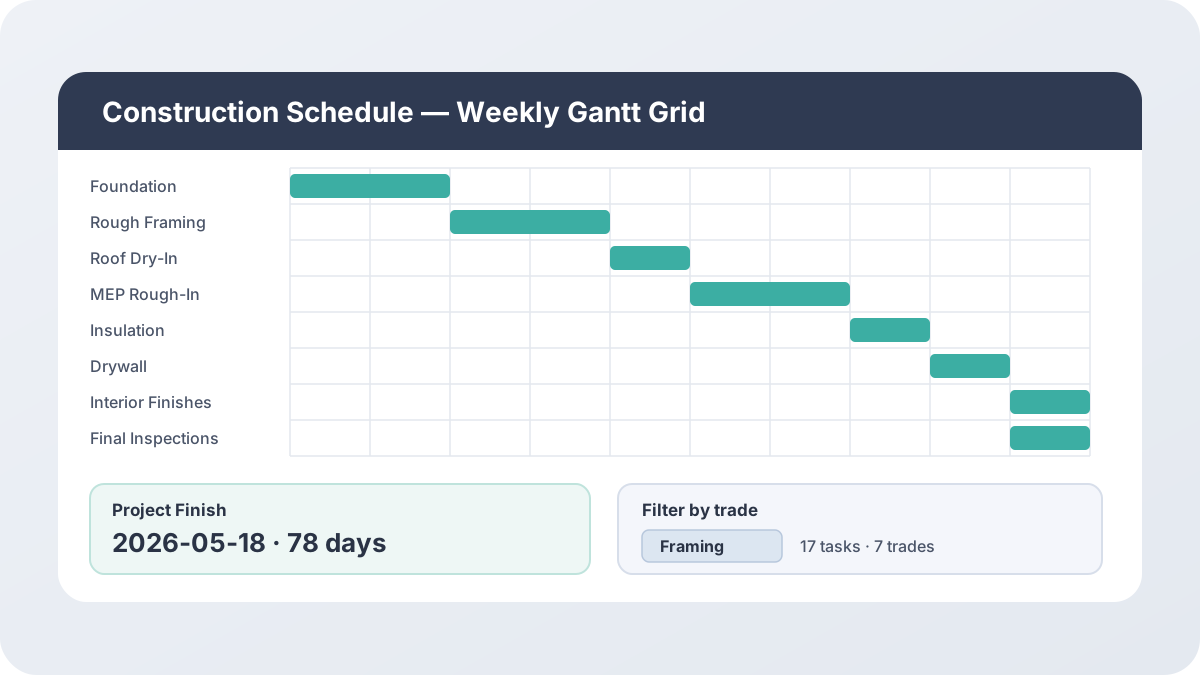
Every construction schedule I’ve built by hand runs into the same wall: task A pushes task B a few days, task B pushes task C, and by the third revision nobody’s sure which date is actually current. This construction schedule template fixes that by chaining every task’s Start date off its predecessor’s Finish date with a formula, so the whole schedule — and the weekly Gantt grid that visualizes it — recalculates the moment one task moves.
Download the construction schedule template — it’s a plain .xlsx, no macros, no external data connections, and no sign-up. Open it in Excel or Google Sheets and start replacing the sample tasks with your own.
Who is this for?
I built this for the person sequencing a single construction job — a general contractor, a project manager, or an owner-builder — who needs a real schedule of works and a Gantt view without opening a dedicated scheduling application. If you can list your tasks, assign each one a trade and a duration, and say which earlier task it starts after, this workbook turns that into a full predecessor-driven schedule: calculated Start and Finish dates, a weekly Gantt grid, and a dashboard that tracks progress by trade. It’s also a solid teaching example for seeing a predecessor chain built entirely from INDEX/MATCH, and for seeing how a bank of small formula-driven cells can stand in for a native Gantt chart control that Excel doesn’t ship with.
What’s in the workbook, sheet by sheet
The workbook ships with five sheets, in this exact order, because each one depends on the sheet before it:
- Instructions — a setup guide plus a clean-room disclosure: every formula, layout, and sample figure in this workbook was authored from scratch for Excel.TV. No vendor template, workbook, or dataset was downloaded, inspected, or adapted to build it.
- Project Setup — the project name, the project start date, the “as of” date used to compute every task’s status, and the master list of trades used by the dropdowns elsewhere in the workbook.
- Schedule of Works — the task list: 17 sample tasks across seven trades, each with a Task ID, a name, a Trade, a Predecessor Task ID, and a Duration in calendar days. Start, Finish, Status, and % Complete are all calculated.
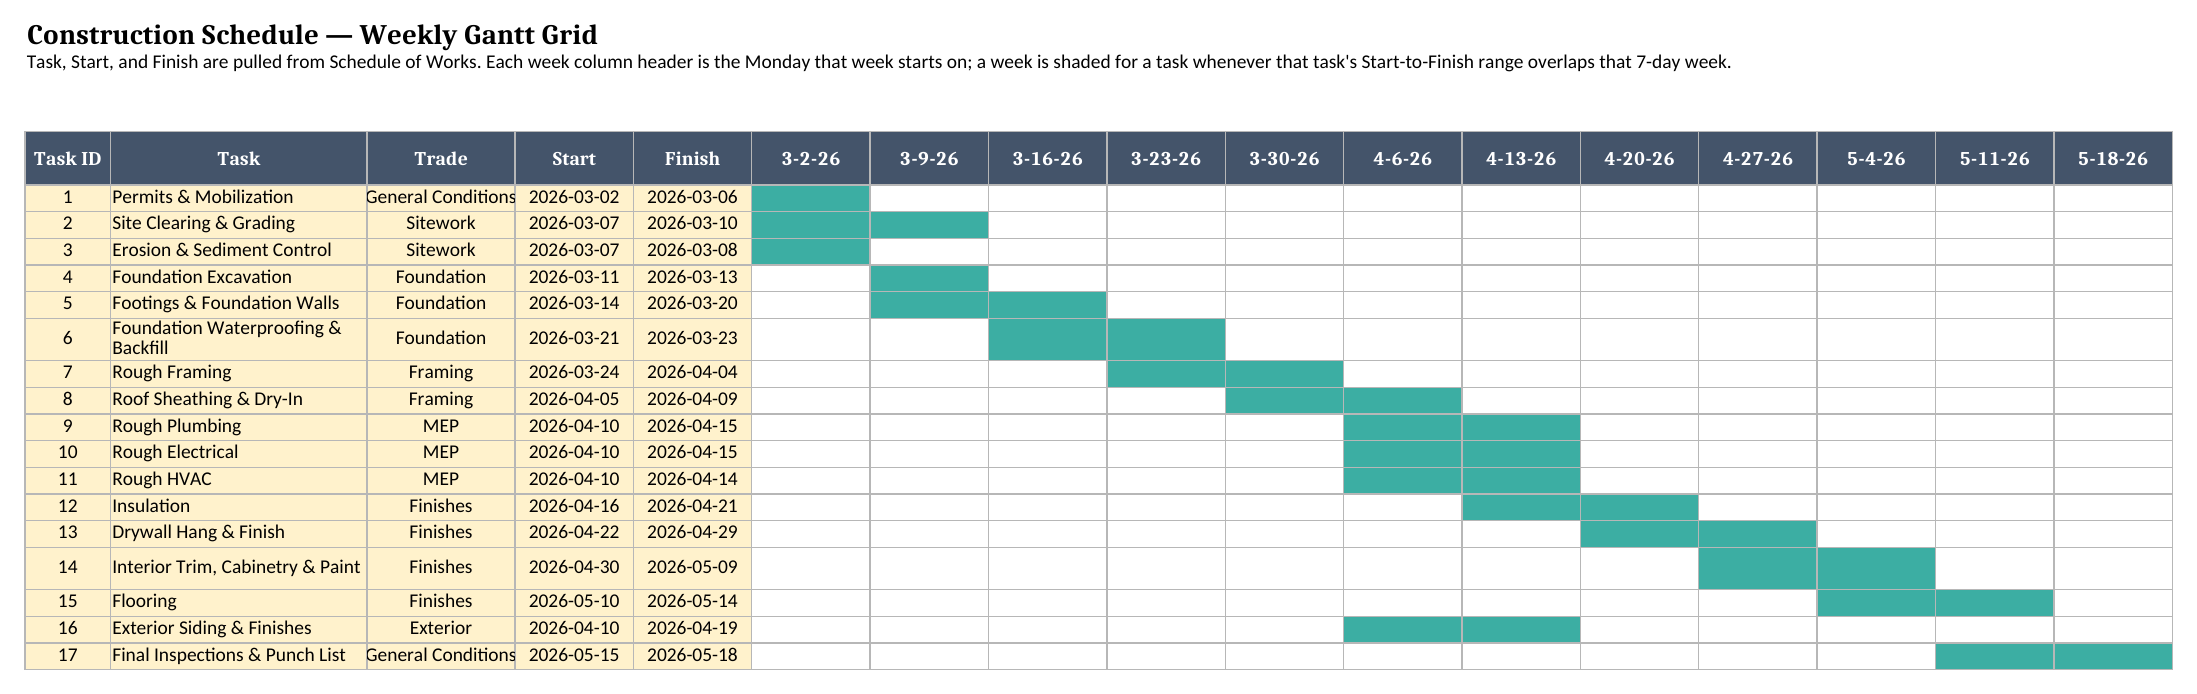
- Gantt — a weekly grid Gantt chart. Task, Start, and Finish are pulled automatically from Schedule of Works, and each week column is shaded wherever a task’s date range overlaps that week.
- Dashboard — a trade selector plus that trade’s task count, total duration, and status breakdown, project-wide totals, and a full tasks-by-trade table.
The required inputs are four things per task: a name, a trade, a duration in calendar days, and a predecessor task ID (or none, for the first task). The main outputs are every task’s calculated Start/Finish/Status/% Complete, the shaded weekly Gantt grid, and the Dashboard’s project totals and tasks-by-trade table — all of which recalculate the instant you change the trade selector, the as-of date, or any task’s duration or predecessor.
How do I set up the construction schedule spreadsheet?
- Open Project Setup and enter your project name and project start date. Set the “as of” date to whatever date you want task status measured against, and edit the trade list if your job uses different trade categories.
- Open Schedule of Works and list every task: give it a unique Task ID, a name, a Trade from the dropdown, a Duration in calendar days, and a Predecessor Task ID. Leave the predecessor blank for the very first task, or for any task that also starts on the project start date.
- Check Start, Finish, Status, and % Complete — all four are calculated the moment you enter a task’s duration and predecessor, with no typing required.
- Open Gantt and confirm the weekly grid looks right — the shaded weeks for every task come straight from its calculated Start and Finish dates.
- Go to Dashboard, pick a trade from the selector, and read that trade’s task count, total duration, and status breakdown, or scroll down to the project totals and the full tasks-by-trade table.
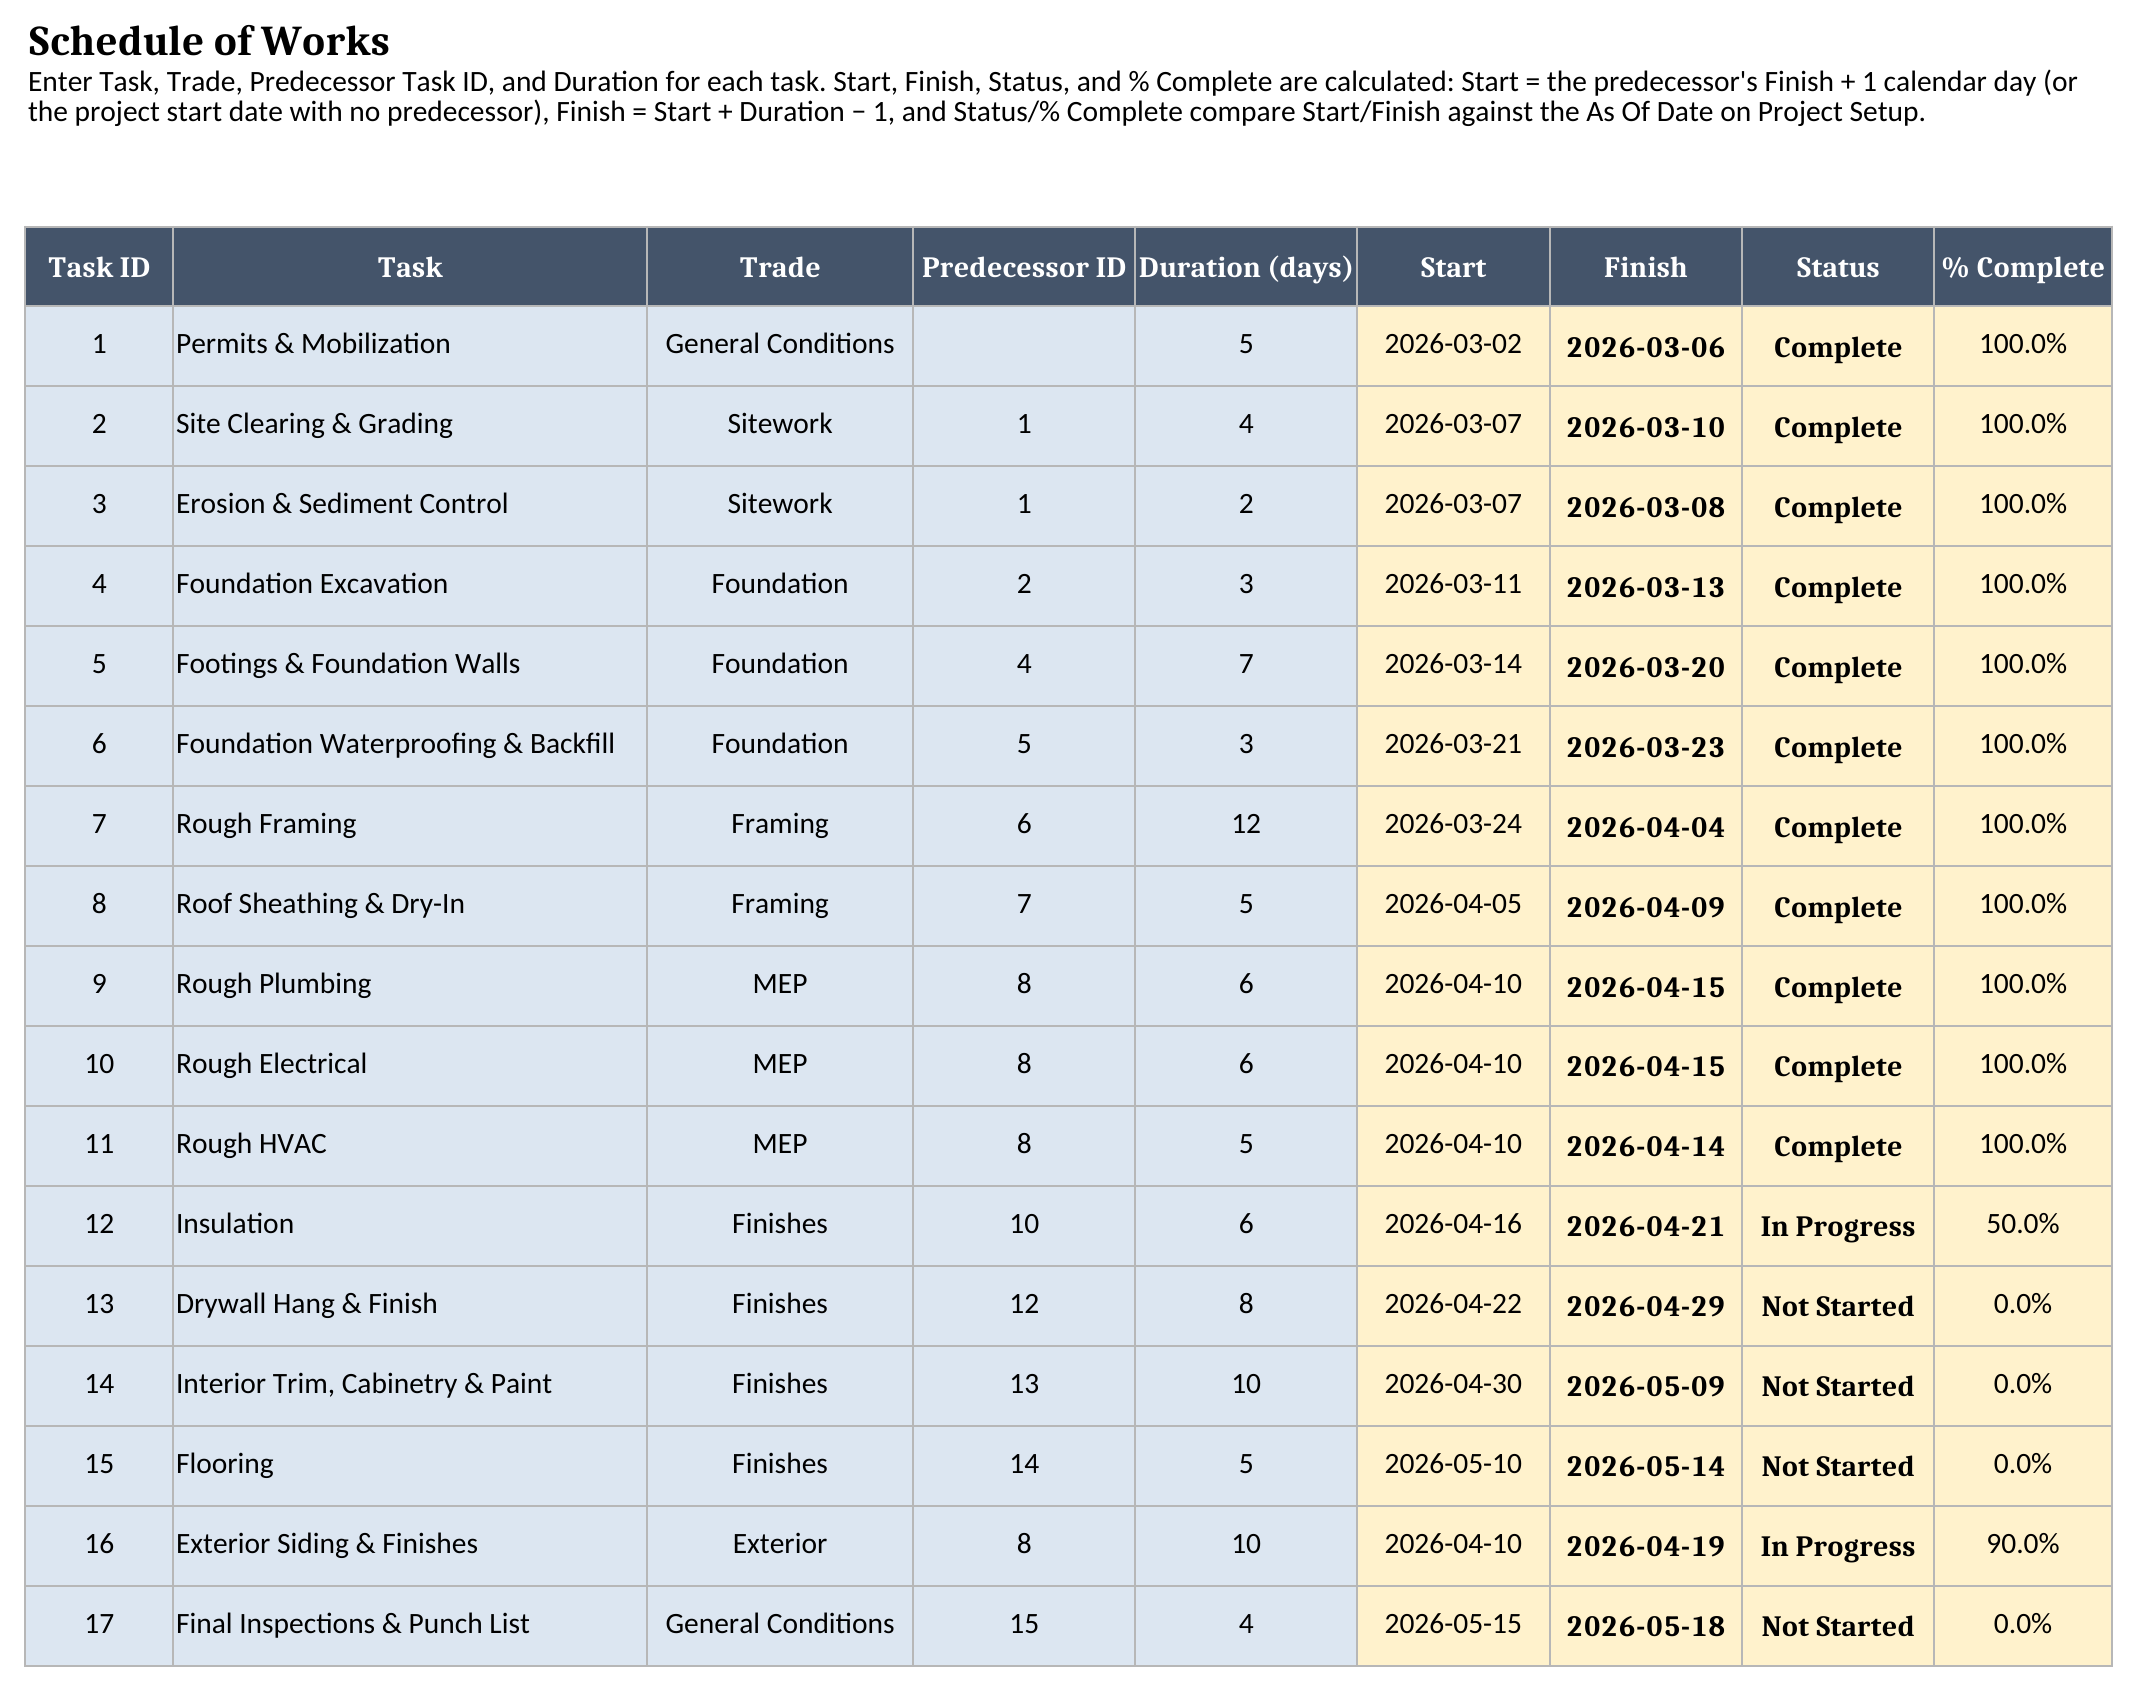
Because Start is an INDEX/MATCH formula rather than typed text, changing one task’s duration ripples forward through every task that (directly or indirectly) comes after it — you never have to manually shift a single date by hand.
How the predecessor chain and the weekly Gantt grid actually work
Every row on Schedule of Works has the same Start formula: if the Predecessor Task ID is blank, Start equals the project start date; otherwise it looks up that predecessor’s Finish date with INDEX/MATCH and adds one calendar day. Finish is just Start plus Duration minus one. That’s the entire scheduling engine — two formulas, repeated down 17 rows — and it’s enough to chain an entire job from a single project start date.
The Gantt sheet doesn’t use a native Excel chart object at all. Each week column header is a date, computed by adding seven days to the previous week’s header, starting from the project start date. Every task row then gets one conditional-formatting rule across all twelve week columns: a week is shaded whenever that task’s Start-to-Finish range overlaps the seven days that week represents. Move a task’s predecessor or duration and the shading redraws on its own — nothing needs to be re-dragged or re-colored.
Worked example: a 17-task custom-home schedule of works
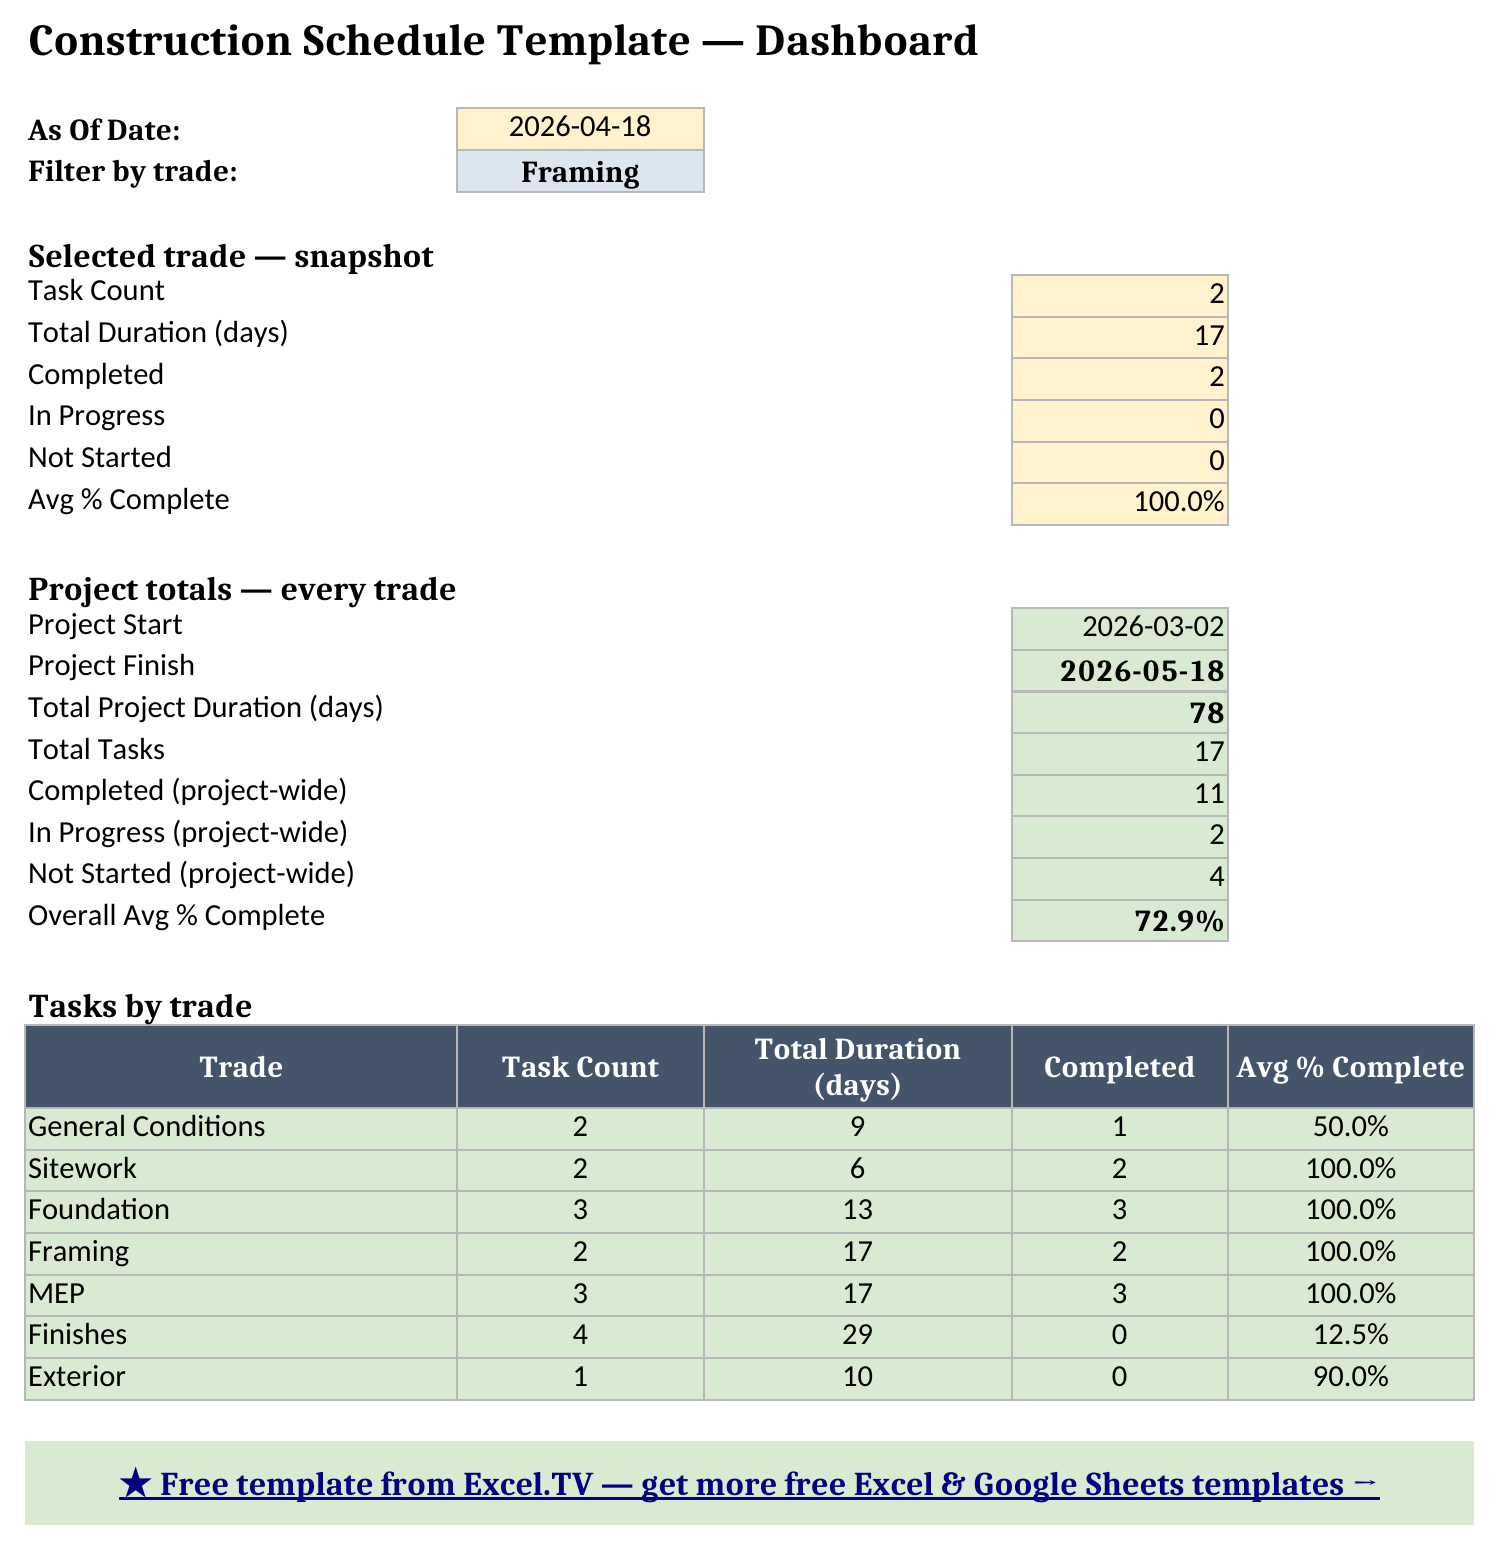
I built one full job’s worth of synthetic sample data into the template — 17 tasks across seven trades, chained from a single project start date of March 2, 2026, with the “as of” date set to April 18, 2026 so you can see tasks in every status at once. Here’s what the Dashboard shows for every trade, pulled straight from the Tasks by Trade table:
| Trade | Tasks | Total Duration (days) | Completed | Avg % Complete |
|---|---|---|---|---|
| General Conditions | 2 | 9 | 1 | 50.0% |
| Sitework | 2 | 6 | 2 | 100.0% |
| Foundation | 3 | 13 | 3 | 100.0% |
| Framing | 2 | 17 | 2 | 100.0% |
| MEP | 3 | 17 | 3 | 100.0% |
| Finishes | 4 | 29 | 0 | 12.5% |
| Exterior | 1 | 10 | 0 | 90.0% |
Chained end to end, those 17 tasks run the project from 2026-03-02 to 2026-05-18 — a total of 78 calendar days. As of April 18, 11 of the 17 tasks are Complete, 2 are In Progress (Insulation, 50% through its 6-day run, and Exterior Siding & Finishes, 90% through its 10-day run), and 4 haven’t started yet, for an overall average of 72.9% complete across the job. Finishes is the trade to watch: with four tasks and 29 total duration-days, it’s the longest single trade on the schedule and hasn’t started as of the as-of date, since Insulation — its first task — only just began.
Grab the construction schedule template if you want to flip the trade selector yourself and watch the snapshot change, or push the as-of date forward a few weeks and watch tasks move from Not Started to In Progress to Complete on their own.
How do I use this in Google Sheets?
Google Sheets is a first-class destination for this construction schedule excel template, not an afterthought. Open Google Sheets, choose File > Import > Upload, select the downloaded .xlsx, and pick “Insert new sheet(s).” Every formula in this workbook — SUM, SUMIF, SUMIFS, IF, IFERROR, INDEX, MATCH, and LARGE — is natively supported in Google Sheets, so nothing needs to be rewritten, and both the trade-selector dropdown and the weekly Gantt grid’s conditional formatting carry over with it.
If you’d rather skip the download-and-import step entirely, use this one-click copy link: make a copy of the Construction Schedule Template in Google Sheets. Google will prompt you to save it to your own Drive, and from there it behaves identically to the Excel version — same sheets, same formulas, same trade selector and Gantt shading.
How this differs from a generic Gantt chart template
My Gantt chart Excel template is the simpler starting point: one task list, a native stacked-bar chart, and no predecessor logic — you set every Start date by hand. This construction schedule template is built for the case where that’s not good enough: when tasks genuinely depend on each other, and you want the schedule to reflow automatically when one task slips. If you don’t need predecessor chaining, start with the Gantt chart template; if you’re sequencing trades where the framing crew can’t start until the foundation cures, this one will save you from re-dating everything by hand every time a task runs long. And if this project also needs job-cost tracking alongside its schedule, my construction budget template tracks original budget, committed cost, and actual cost by the same division/trade breakdown this schedule uses.
Limitations to know before you rely on this
A few things are worth knowing before you put a real job’s schedule in here:
- Calendar days, not working days. There’s no
WORKDAY-style weekend or holiday skipping — a task that spans a weekend just keeps running through it in the Duration count. If your crew works a fixed five-day week, either build that into each task’s duration by hand or treat every date here as a calendar-day estimate rather than a crew-day commitment. - One predecessor per task. When several tasks all have to finish before the next one starts — rough plumbing, electrical, and HVAC all wrapping up before insulation, for example — point the Predecessor Task ID at whichever of them finishes latest. The workbook won’t detect that for you, so re-check it if an upstream duration changes and a different predecessor ends up finishing last.
- Status and % Complete reflect the plan, not field-reported progress. Both are driven entirely by comparing the “as of” date on Project Setup against each task’s calculated Finish and Start — there’s no separate “actual progress” field to override them if a task is genuinely running behind. Push the as-of date and every task’s status moves with it, whether or not that matches what’s actually happening on site.
- The Gantt grid covers 12 weeks. That’s enough for this sample 78-day schedule with room to spare; a longer project needs more week columns added the same way the existing ones were built (each one is just the previous week’s date plus seven).
- Every sheet needs the same Task ID set. Gantt and Dashboard both look up tasks from Schedule of Works by Task ID, so keep IDs unique and don’t delete a task from one sheet without checking whether anything else still points at it.
- No macros, no external connections. Everything here is a native formula. That’s deliberate — it’s what keeps the workbook portable between Excel and Google Sheets with zero substitutions.
I’d rather flag these limitations up front than have you discover them mid-job. Once you know the calendar-days rule and the single-predecessor rule, the rest of the workbook takes care of itself.
Download the construction schedule template and start sequencing your own job.
