
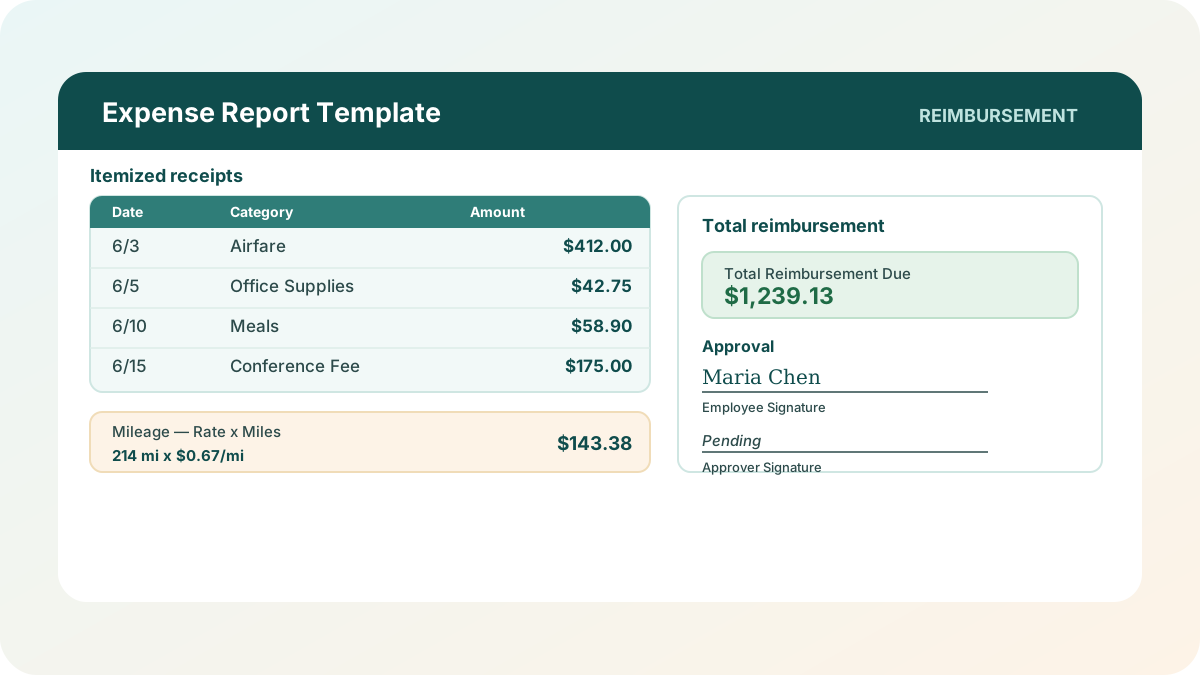
Every employee reimbursement process I’ve watched fall apart breaks in the same three places: someone adds up a stack of receipts by hand and gets it wrong, mileage gets reimbursed at whatever rate the employee remembers instead of the correct one, and nobody has an answer when a manager asks “how much do we owe Sam right now, across everything he’s submitted this quarter.” This expense report template fixes exactly those three things — itemized receipts that total themselves, a mileage line that’s always rate times miles, and a per-employee summary that answers the outstanding-balance question without a calculator.
Download the expense report template — it’s a plain .xlsx, no macros, no external data connections, and no sign-up. Open it in Excel or Google Sheets and start swapping the sample employee and receipt data for your own.
Who is this template for?
I built this for the submit-and-approve side of employee reimbursement: an employee who incurs a client dinner, a flight, a hotel stay, or a pile of mileage on the job and needs to get paid back for it, and a manager who has to review and sign off on that report before it goes to accounting. If your business is small enough that a dedicated expense-management platform isn’t worth the subscription yet, but big enough that “email me a photo of your receipts” has started causing real problems — duplicate reimbursements, mileage nobody double-checked, no record of who’s still owed money — this template is built for that gap.
It’s worth being precise about what this is not. This is an employee reimbursement workbook — one person’s expenses, submitted and approved one report at a time. It is not a company-wide operating expense tracker for monitoring recurring vendor bills, subscriptions, or departmental budget burn — that’s a different shape of spreadsheet with a different job. If what you actually need is per-department opex monitoring rather than “did Maria get reimbursed for her flight,” this isn’t the right tool, and I’d rather tell you that up front.
What’s in the workbook, sheet by sheet
The workbook ships with four working sheets plus Instructions, in this order:
- Instructions — setup steps and a clean-room disclosure: every formula, layout, and sample figure was authored from scratch for Excel.TV. No vendor template, workbook, or dataset was downloaded, inspected, or adapted to build it.
- Settings — your mileage reimbursement rate and an Employee Directory (name, department, approver), read by both Expense Report and Per Employee Summary so your roster lives in one place.
- Expense Report — the fillable form: pick an employee, set the report period, itemize receipts, enter business miles driven, and complete an approval block with a status of Pending, Approved, Rejected, or Reimbursed.
- Expense Log — a running record of every report submitted. The bottom row links live to Expense Report; rows above are historical, each carrying its own approval status.
- Per Employee Summary — a rollup by employee: reports submitted, total submitted, total reimbursed, total outstanding, and average reimbursement per report.
The required inputs are the mileage rate and directory on Settings, and — on Expense Report — the employee name, report period, each receipt’s details, business miles driven, and the approval block. The main outputs are Subtotal — Receipts, Mileage Reimbursement Amount, and Total Reimbursement Due on Expense Report, plus Total Submitted, Reimbursed, and Outstanding on Per Employee Summary — all of which recalculate the instant you change an input cell.
How do I set up the expense report template?
- Open Settings, set your mileage rate, and replace the sample Employee Directory — Employee Name, Department, Approver — with your own team.
- Open Expense Report and choose an Employee Name from the dropdown; Department and Approver fill in automatically from the directory.
- Set the Report Period (From/To) dates, then fill in Itemized Receipts — Date, Category, Vendor/Description, Payment Method, Amount — one row per receipt.
- Enter Business Miles Driven. Mileage Rate pulls from Settings automatically, and Mileage Reimbursement Amount recalculates as rate times miles.
- Review Total Reimbursement Due, then complete the Approval block: employee and approver signature/date, and an Approval Status of Pending, Approved, Rejected, or Reimbursed.
Don’t type a number directly into the Subtotal cell or the Mileage Reimbursement Amount cell — both are formulas, and overwriting one stops it from updating the next time you edit a receipt line or the mileage figure above it. Need more receipt rows? Insert one inside the existing table (between the header and the Subtotal row), not below it, so the SUM formula picks it up automatically.
How the mileage line and the employee lookup actually work
The mechanic I’d point to first is the mileage line, because it’s the one piece of an expense report I’ve most often seen done by hand, with a rate someone half-remembers typed straight into a total. Here it’s one formula: Mileage Reimbursement Amount is =ROUND(Business Miles Driven * Mileage Rate, 2), and Mileage Rate itself is a live reference to the single rate cell on Settings — update the rate once, and every future report picks up the new number automatically instead of depending on whoever’s filling out the form to remember it. ROUND keeps the result at a clean two decimal places instead of a floating-point value that technically differs from what a calculator or a paper check would show.
The second mechanic worth calling out is Department and Approver auto-filling the moment you pick an Employee Name — both are INDEX/MATCH lookups against the Employee Directory on Settings, each wrapped in IFERROR so a typo or an employee who hasn’t been added yet returns “Not on file” instead of a #N/A error breaking the sheet. The same discipline shows up on Per Employee Summary’s Avg per Report column — =IFERROR(ROUND(Total Submitted/Reports Submitted,2),0) — so an employee with zero reports logged shows a clean $0.00 instead of a #DIV/0! error.
Worked example
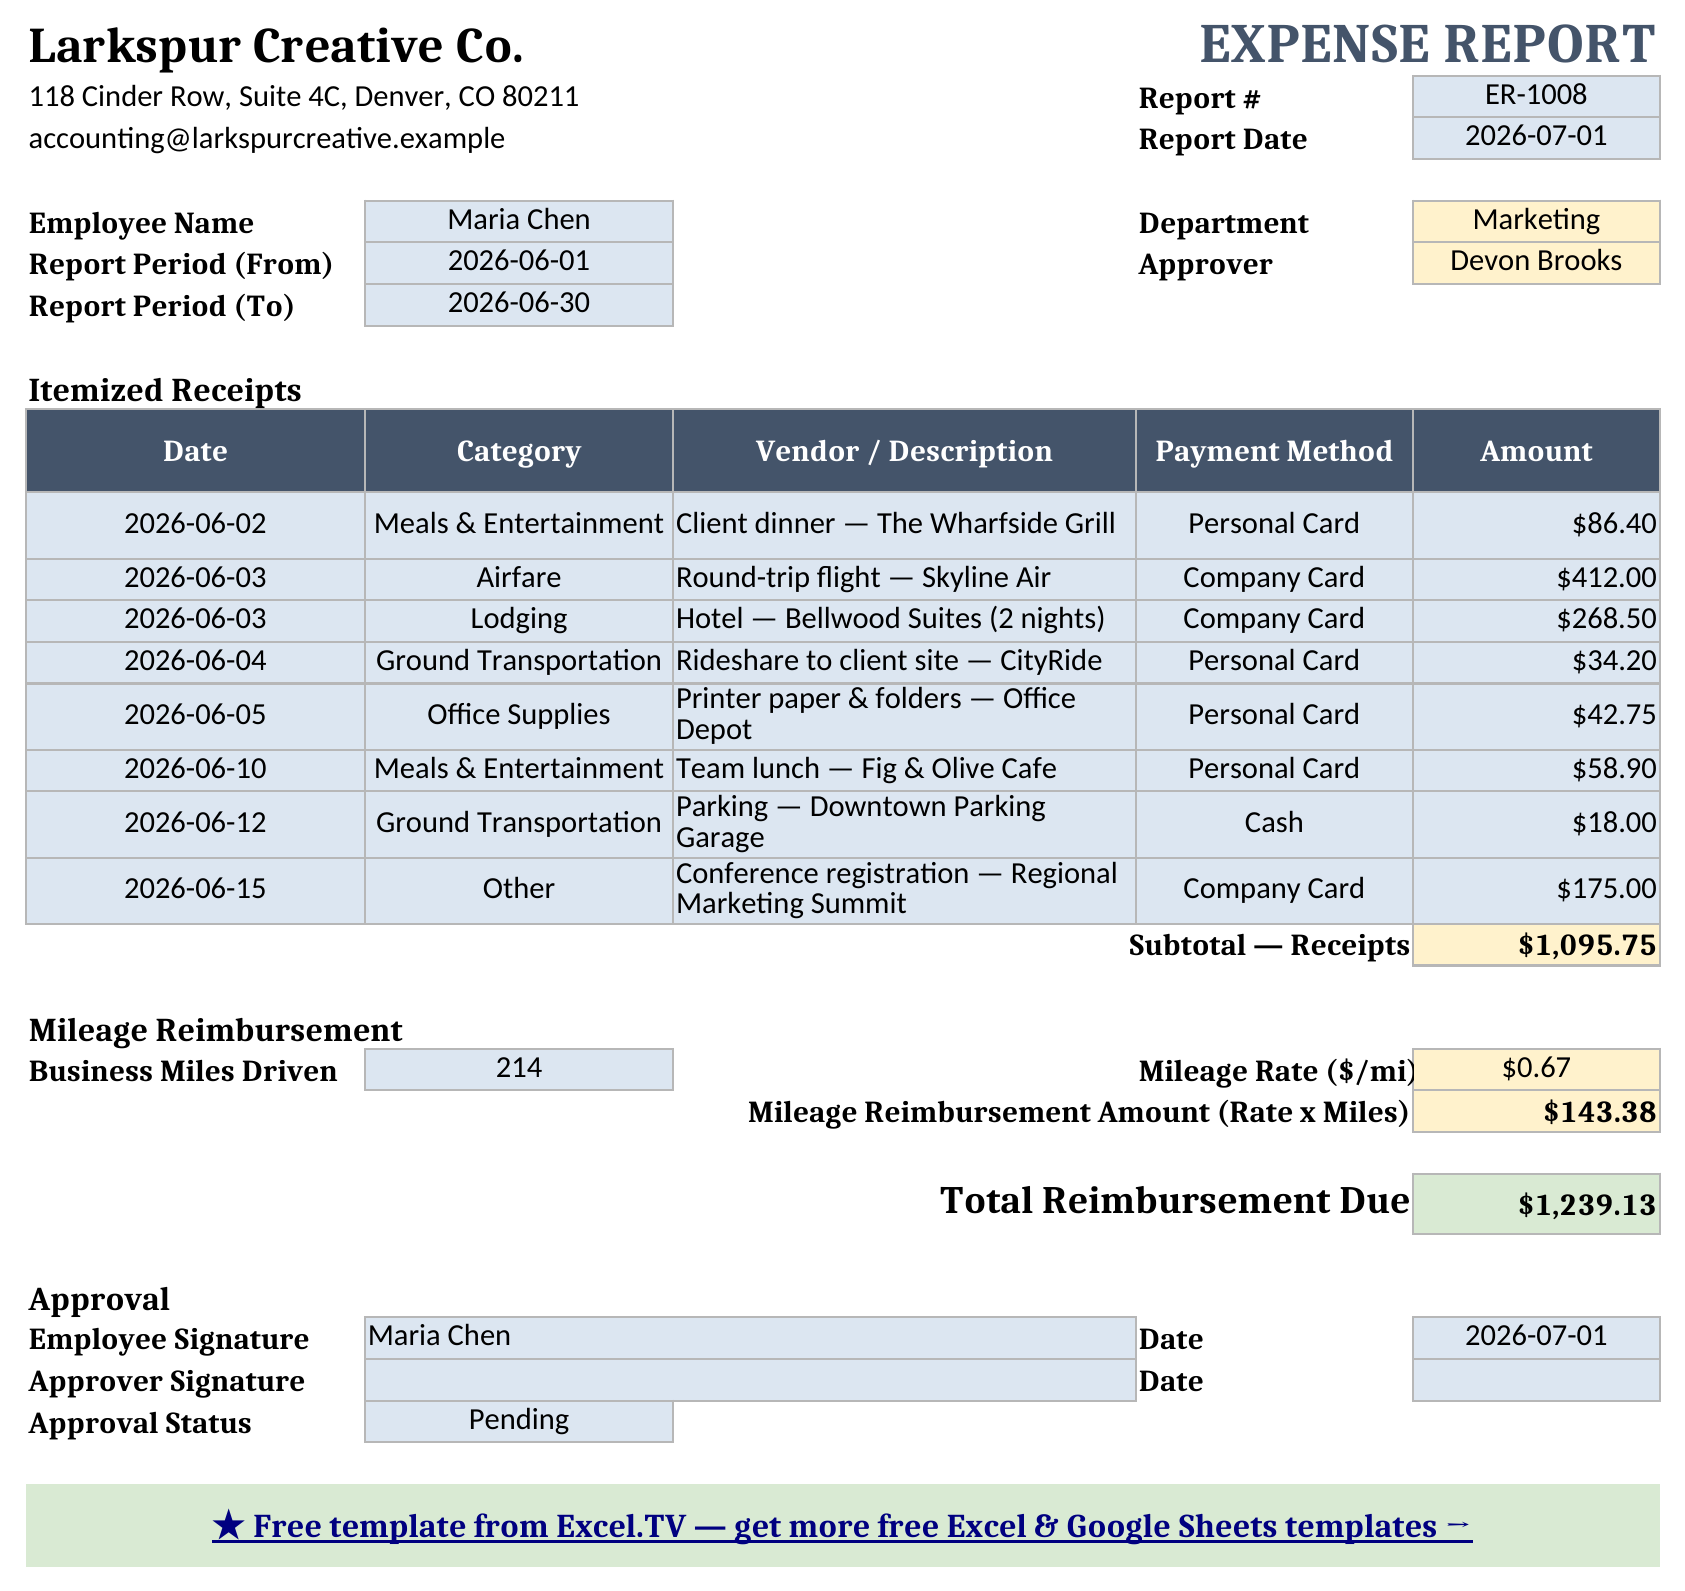
Here’s the sample report in the template, recalculated end to end — Maria Chen’s June 2026 report, eight itemized receipts plus 214 business miles at $0.67/mile:
| Item | Category | Amount |
|---|---|---|
| Client dinner — The Wharfside Grill | Meals & Entertainment | $86.40 |
| Round-trip flight — Skyline Air | Airfare | $412.00 |
| Hotel — Bellwood Suites (2 nights) | Lodging | $268.50 |
| Rideshare to client site — CityRide | Ground Transportation | $34.20 |
| Printer paper & folders — Office Depot | Office Supplies | $42.75 |
| Team lunch — Fig & Olive Cafe | Meals & Entertainment | $58.90 |
| Parking — Downtown Parking Garage | Ground Transportation | $18.00 |
| Conference registration — Regional Marketing Summit | Other | $175.00 |
| Line | Value |
|---|---|
| Subtotal — Receipts | $1,095.75 |
| Mileage (214 mi x $0.67/mi) | $143.38 |
| Total Reimbursement Due | $1,239.13 |
Every number above came straight out of the workbook after a full formula recalculation — nothing was typed in or rounded by hand for this article. $143.38 is exactly what ROUND(214*0.67,2) returns, and Total Reimbursement Due is Subtotal — Receipts plus that Mileage Reimbursement Amount, landing on $1,239.13.
How the per-employee summary ties it all together
This is the sheet that does the most real work once more than one person is submitting reports. Expense Log accumulates every report — seven historical entries across four employees, plus Maria Chen’s live report above as the eighth row — and Per Employee Summary rolls that up per person with SUMIF and SUMIFS: Total Submitted sums every report’s Total for that employee, Total Reimbursed does the same but only where Status equals “Reimbursed,” and Total Outstanding is simply the difference. Recalculated across the sample data, the four employees combined have submitted $4,093.93, of which $1,775.05 has been reimbursed, leaving $2,318.88 still outstanding — and the single largest report in the log, pulled with a LARGE formula, is Maria Chen’s $1,239.13 June submission.
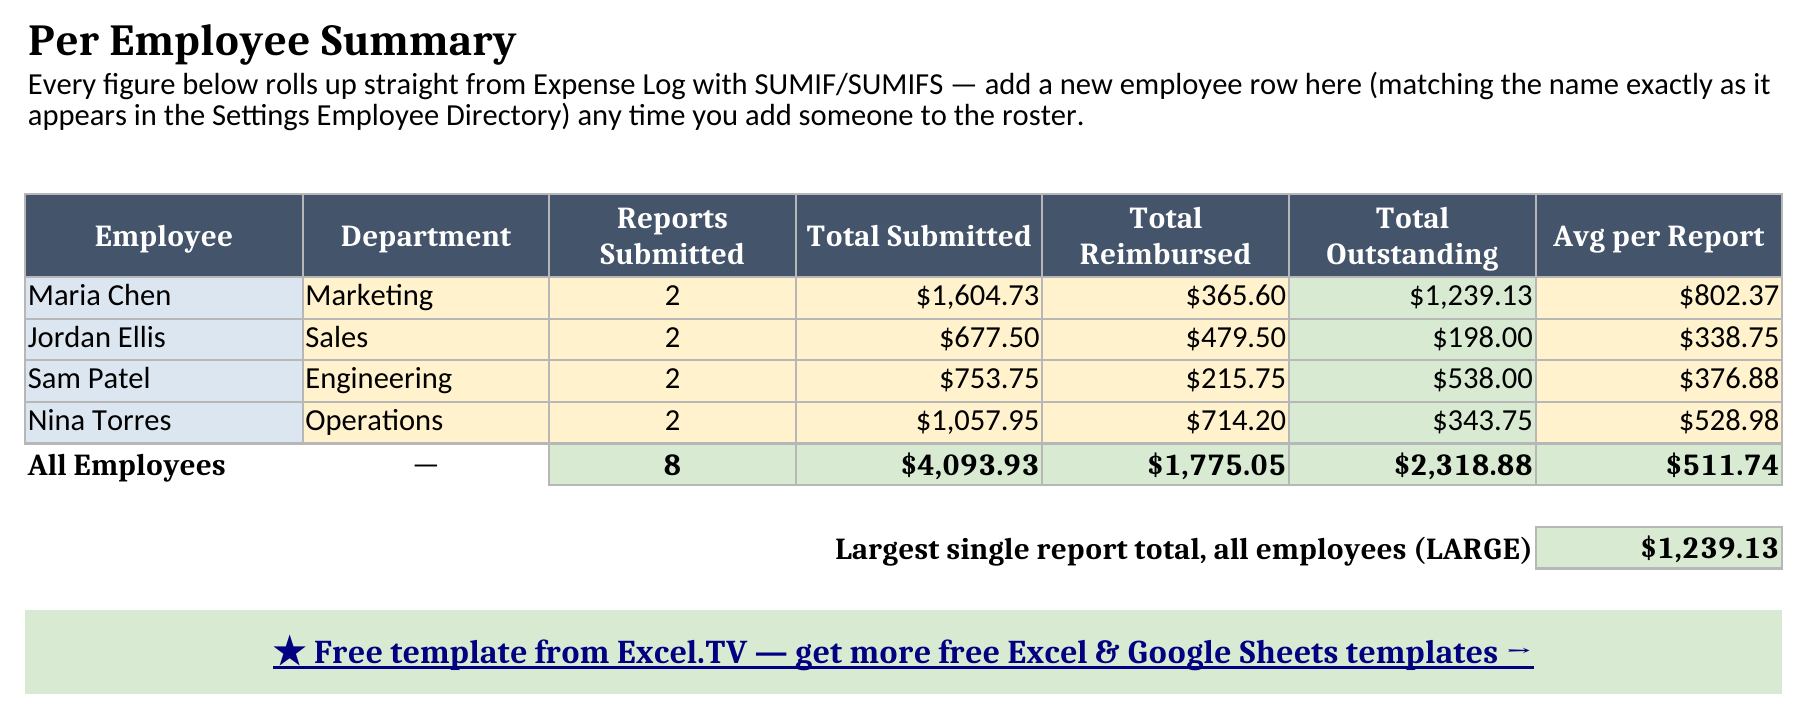
That grand-total row is the number a manager actually gets asked for — not “what did Maria submit” but “what do we owe everyone right now.” Getting there by hand from a stack of individual reports is exactly the kind of task that quietly eats an afternoon; here it’s four SUMIF formulas and a SUM.
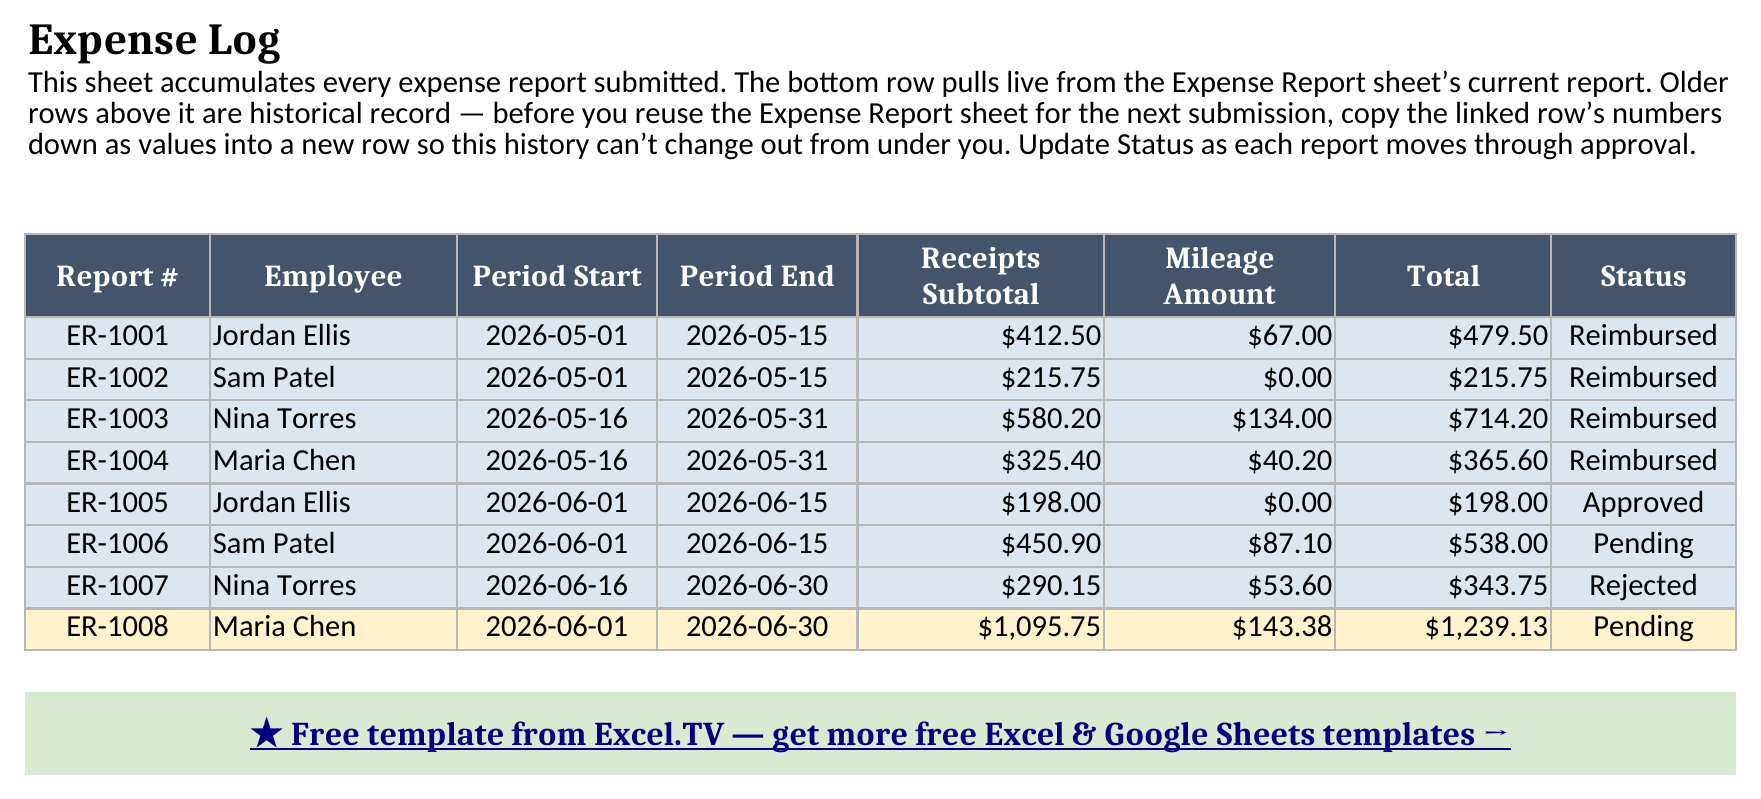
One more note on Expense Log’s bottom row: it’s a live formula link to whatever’s on Expense Report, not a snapshot. That’s deliberate — while a report is in progress, the log shows it accurately. But once that report’s status moves to Reimbursed, copy that row’s numbers down into a new row as values before reusing Expense Report for the next submission. Skip that step and the “history” you thought you’d saved will silently update to reflect whatever’s currently open — a quiet data-integrity problem that erodes trust in a shared spreadsheet fast.
How do I use this in Google Sheets?
Google Sheets is a first-class destination for this template, not an afterthought. Open Google Sheets, choose File > Import > Upload, select the downloaded .xlsx, and pick “Insert new sheet(s).” Every formula here — SUM, SUMIF, SUMIFS, IF, IFERROR, INDEX, MATCH, ROUND, LARGE — is natively supported in Google Sheets, so nothing needs to be rewritten, and every dropdown carries its data validation over with it.
If you’d rather skip the download-and-import step entirely, use this one-click copy link: make a copy of the Expense Report Template in Google Sheets. Google will prompt you to save it to your own Drive, and from there it behaves identically to the Excel version — same sheets, same formulas, same mileage math.
How this differs from a generic expense report template
Most free expense report templates handle one report at a time and stop there — a form with a total at the bottom, nothing that connects one employee’s history to another’s. This one pairs two things I don’t see together often: an auto-filling employee lookup that keeps Department and Approver from ever being retyped incorrectly, and a Per Employee Summary designed to actually answer “who’s owed what.” If you’re the only person submitting expenses, a bare single-sheet template will serve you fine. If you manage a team, the summary sheet here does real work before anyone has to ask the outstanding-balance question.
If your reimbursement volume feeds a broader monthly close, my finance dashboard excel template picks up where this leaves off, turning actuals and budget into a one-page variance view. And if you’re tracking hours rather than dollars for the same team, my timesheet template uses the same Settings-driven lookup approach for pay-period math.
Limitations to know before you rely on this
A few things worth knowing before you put real reimbursement numbers in:
- Mileage is a single flat rate per report period — no per-trip rate override, and no distinction between a personal vehicle and a rental car.
- The Employee Name dropdown must match the Employee Directory exactly, or Department and Approver fall back to “Not on file” rather than guessing — add new hires to Settings first.
- No receipt image attachment or OCR. This is a numeric ledger, not a document management system — keep receipts filed separately.
- One currency, one flat mileage rate, one approver per report — no multi-currency support, per-diem calculation, or multi-level approval routing.
- Expense Log’s current row is a live link, not a snapshot — copy its numbers down as values before reusing Expense Report for the next submission (see above).
- No macros, no external connections. Everything here is a native formula, which is what keeps the workbook portable between Excel and Google Sheets with zero substitutions.
I’d rather you know these going in than discover them the first time a report doesn’t fit the template’s assumptions.
Download the expense report template and start replacing the sample employees, receipts, and mileage figures with your own — the lookup, the mileage math, and the per-employee summary will all follow.
