
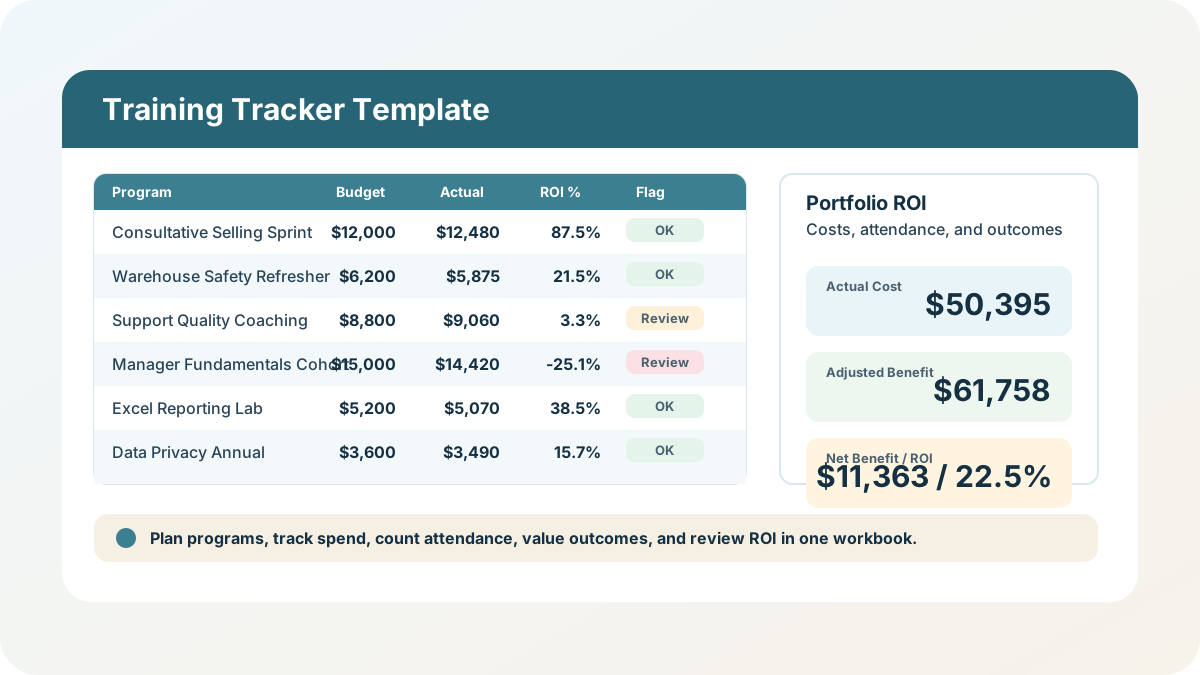
The training spreadsheets I see most often stop at attendance. They can tell you who sat through a class, sometimes who completed a module, and occasionally which department asked for the training in the first place. What they usually cannot answer is the harder question: did the training justify the cost? This training tracker template excel workbook is my answer to that gap — a general employee training tracker with a real budget and ROI module built in, so a training plan, actual spend, attendance, outcome movement, and ROI all reconcile in one file.
Download the training tracker template — it’s a plain .xlsx, no macros, no external data connections, no video gate, and no sign-up. Open it in Excel or import it into Google Sheets and replace the synthetic sample programs with your own.
Who is this template for?
I built this for the HR, operations, finance, or department leader who needs more than a completion checklist. If your only question is “who is overdue for required onboarding?” my Excel training plan template is the better fit, because it is built around due dates and overdue flags. This workbook is for the next layer of tracking: which training programs are planned, what they cost, who attended, what outcome moved afterward, and whether the estimated benefit clears the actual spend.
That is why I kept training budget and ROI as a substantive module instead of treating it as a decorative dashboard number. A useful excel training tracker template should let you explain the sample math line by line: budget goes on one sheet, actual invoices go on another, attendance is counted from participant rows, outcome value is documented separately, and ROI is calculated only after those pieces agree.
What’s in the workbook, sheet by sheet
The workbook ships with six sheets, in this exact order:
- Instructions — setup steps, a colour legend, Google Sheets import notes, limitations, and a clean-room disclosure: every formula, layout, sample employee name, program name, date, cost, attendance record, and outcome figure in this workbook was authored from scratch for Excel.TV. No vendor workbook, template, branding, or sample dataset was downloaded, inspected, or adapted.
- Training Plan — the master training-program list: Program ID, Program Name, Department, Training Type, Required flag, Start Date, End Date, Target Attendees, Budget Hours, Planned Budget, and Status.
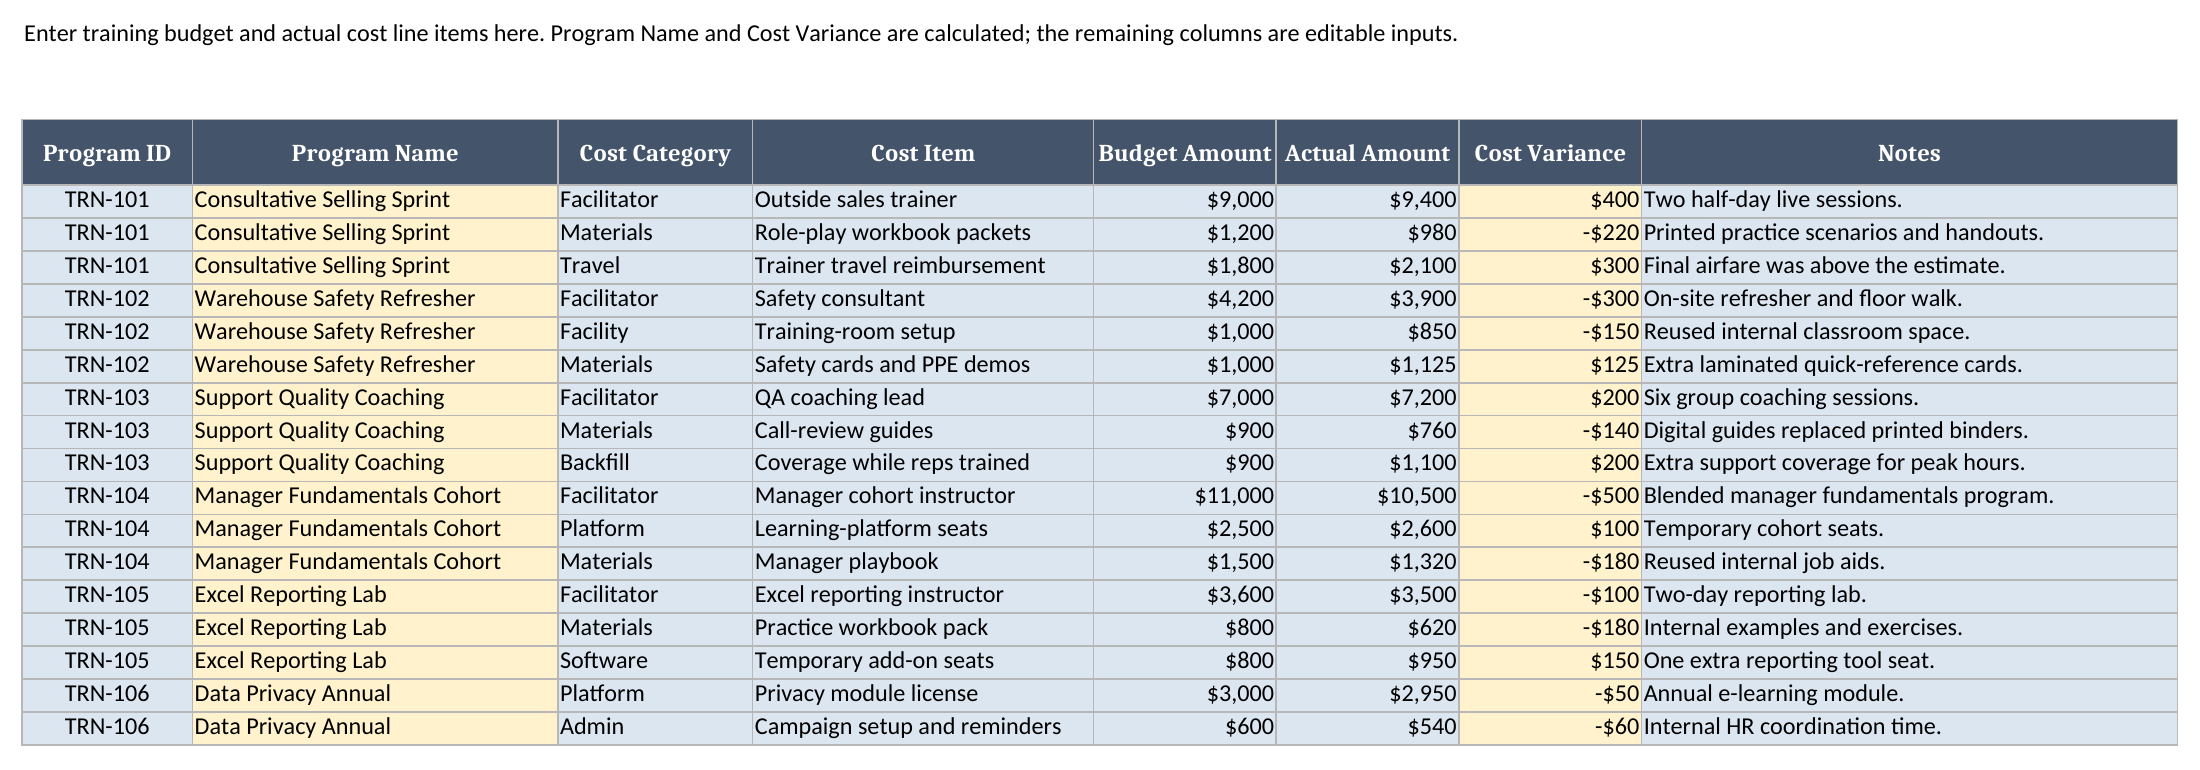
- Costs — budget and actual cost line items by Program ID. Program Name is looked up automatically from Training Plan, and Cost Variance calculates Actual Amount minus Budget Amount.
- Attendance — one row per planned participant. Program Name is looked up automatically, Attended Count calculates from the Yes/No field, and ROI Summary rolls up attendance and completed hours by Program ID.
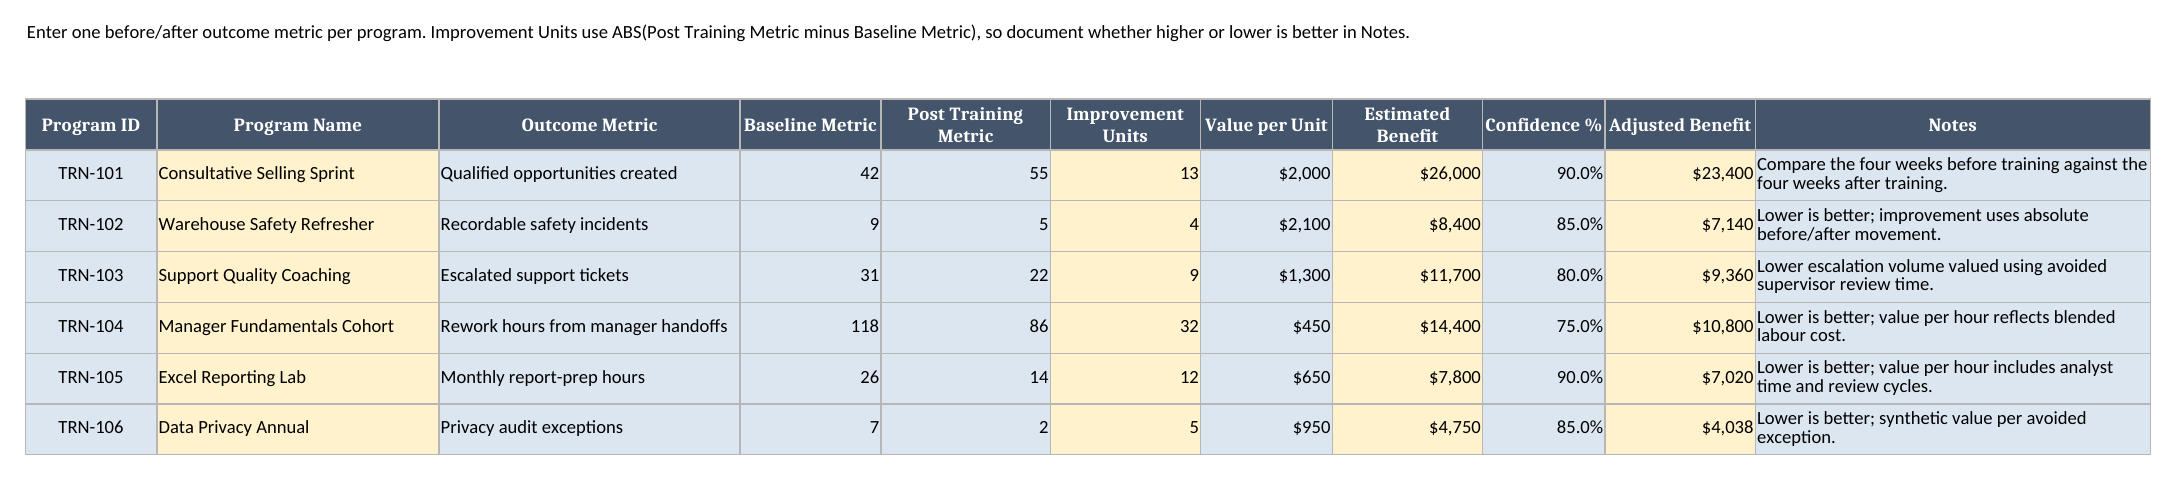
- Outcomes — one before/after outcome metric per program. Improvement Units, Estimated Benefit, and Adjusted Benefit are calculated from the inputs.
- ROI Summary — the output sheet: target attendees, attended count, attendance rate, planned budget, actual cost, cost variance, completed hours, adjusted benefit, net benefit, ROI percentage, review flag, and the top three programs by net benefit.
The required inputs are the training program list, cost line items, attendance rows, and one outcome metric per program. The main outputs are the ROI Summary fields: attendance rate, actual cost, adjusted benefit, net benefit, ROI %, and review flag.
How do I set up my own training tracker?
- Open Training Plan and replace the six sample programs with your own. Keep each Program ID unique; every lookup and roll-up depends on it.
- Open Costs and enter one row per budget or actual cost item: facilitator fees, platform seats, travel, backfill coverage, materials, software, or whatever your training budget uses.
- Open Attendance and enter one row per planned participant. Mark Attended as Yes or No, then enter Hours Completed for the people who attended.
- Open Outcomes and choose one measurable before/after metric per program. Enter the baseline value, post-training value, value per improvement unit, and confidence percentage.
- Open ROI Summary and review which programs are working, which ones have attendance issues, and which ones need a closer look because ROI is negative.

How the budget and cost tracker works
Training Plan holds the planned budget at the program level, but Costs is where the audit trail lives. I split each program into line items because a single “training cost” number is too hard to review later. Consultative Selling Sprint, for example, has separate rows for facilitator, materials, and travel. The workbook sums the Actual Amount column by Program ID on ROI Summary with SUMIFS, then compares that actual cost against Training Plan’s planned budget.
In the sample workbook, the full portfolio has $50,800 of planned budget and $50,395 of actual cost, so it is $405 under budget overall. That does not mean every program was under budget. Consultative Selling Sprint ran $480 over plan because travel came in high, while Warehouse Safety Refresher came in $325 under plan. I want both stories visible, because a portfolio-level underspend can hide a program-level miss.
How the attendance and outcome math feeds ROI
Attendance is intentionally row-based: one planned participant per row, not a typed total. The Attendance sheet calculates an Attended Count of 1 when Attended = Yes and 0 otherwise; ROI Summary then rolls that helper column up with SUMIFS by Program ID and divides it by Target Attendees from Training Plan. That gives you the attendance rate without trusting a hand-entered count, while keeping the formula set portable.
Outcomes is where the ROI estimate starts. For each program, the workbook calculates Improvement Units as ABS(Post Training Metric - Baseline Metric), then multiplies that by Value per Unit to get Estimated Benefit. The final step is a confidence adjustment: Estimated Benefit * Confidence %. I added that confidence field because training ROI is rarely as certain as an invoice. If you think only 75% of the observed movement is reasonably attributable to the training, put 75% in the workbook and let the benefit come down accordingly.
For Consultative Selling Sprint, the sample metric is Qualified opportunities created: baseline 42, post-training 55, improvement 13 units, value per unit $2,000, estimated benefit $26,000, confidence 90%, and adjusted benefit $23,400. Against actual cost of $12,480, that produces $10,920 of net benefit and an 87.5% ROI.
Worked example: six training programs with cost, attendance, and ROI
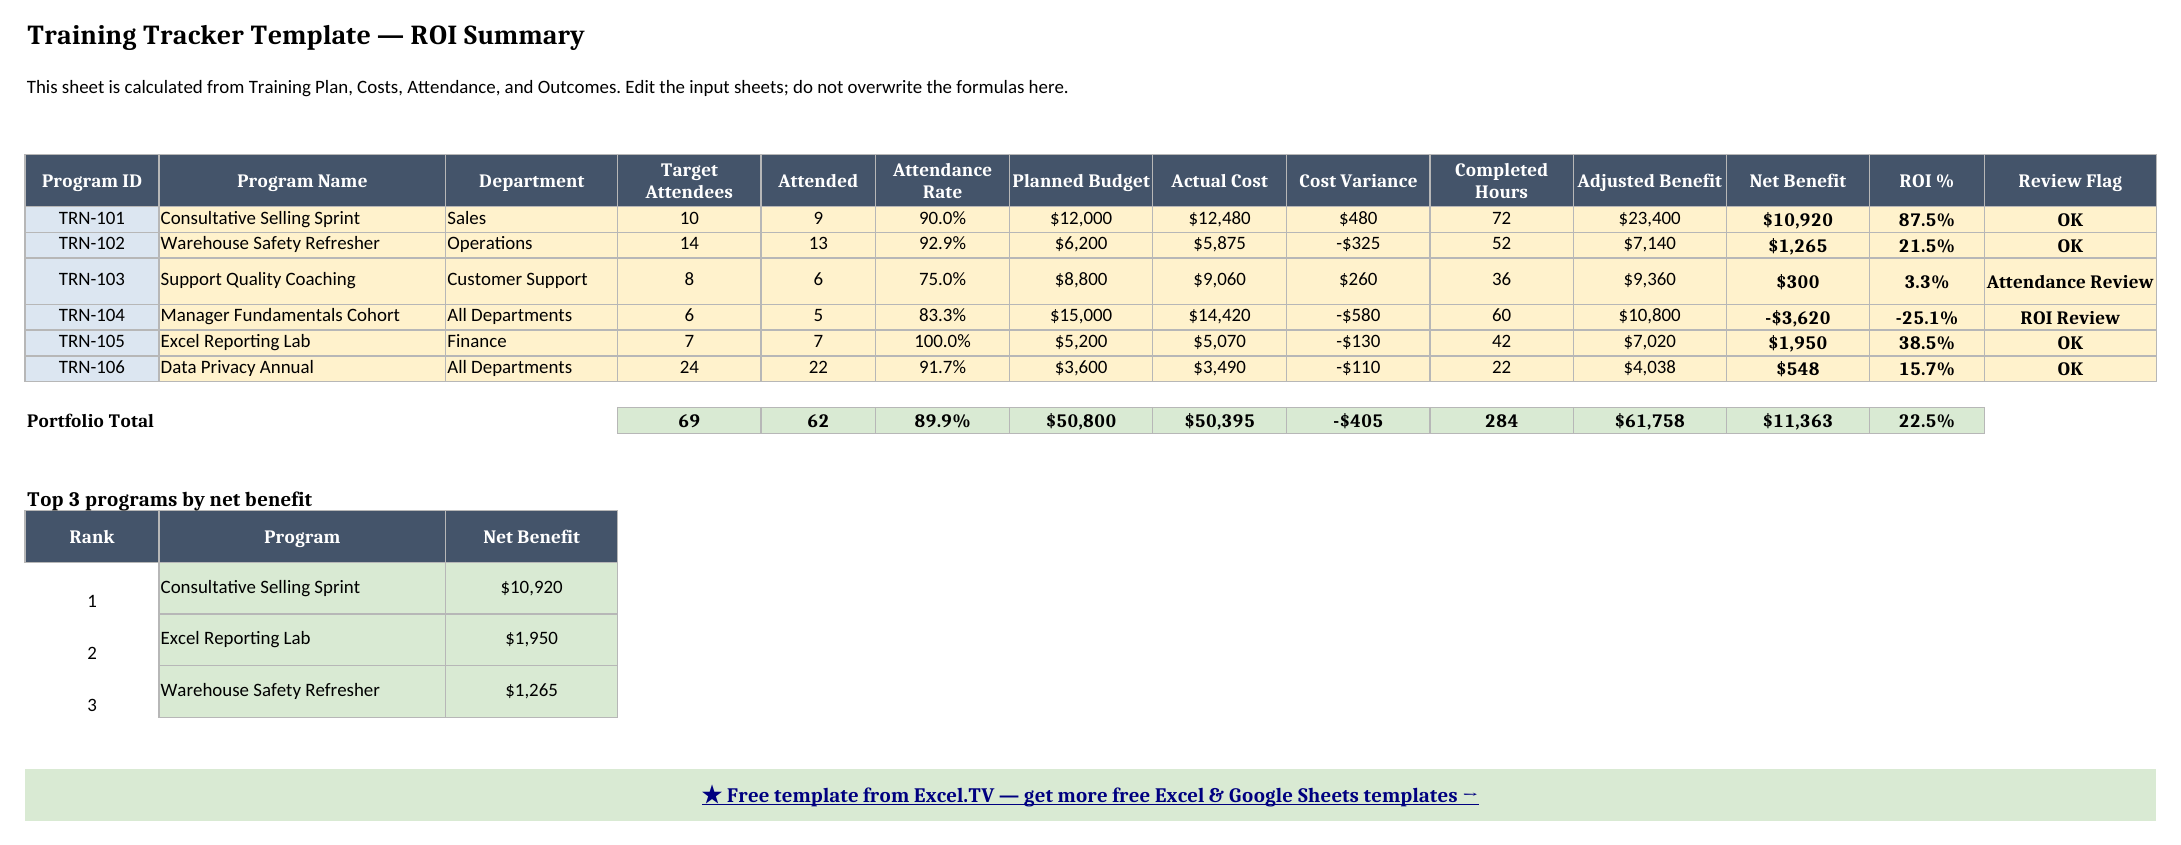
Here is the recalculated ROI Summary output from the sample workbook:
| Training program | Attended / Target | Attendance Rate | Actual Cost | Adjusted Benefit | Net Benefit | ROI % | Review Flag |
|---|---|---|---|---|---|---|---|
| Consultative Selling Sprint | 9 / 10 | 90.0% | $12,480 | $23,400 | $10,920 | 87.5% | OK |
| Warehouse Safety Refresher | 13 / 14 | 92.9% | $5,875 | $7,140 | $1,265 | 21.5% | OK |
| Support Quality Coaching | 6 / 8 | 75.0% | $9,060 | $9,360 | $300 | 3.3% | Attendance Review |
| Manager Fundamentals Cohort | 5 / 6 | 83.3% | $14,420 | $10,800 | -$3,620 | -25.1% | ROI Review |
| Excel Reporting Lab | 7 / 7 | 100.0% | $5,070 | $7,020 | $1,950 | 38.5% | OK |
| Data Privacy Annual | 22 / 24 | 91.7% | $3,490 | $4,038 | $548 | 15.7% | OK |
And here are the portfolio totals at the bottom of ROI Summary:
| Target Attendees | Attended | Attendance Rate | Planned Budget | Actual Cost | Cost Variance | Completed Hours | Adjusted Benefit | Net Benefit | ROI % |
|---|---|---|---|---|---|---|---|---|---|
| 69 | 62 | 89.9% | $50,800 | $50,395 | -$405 | 284 | $61,758 | $11,363 | 22.5% |
The ranking table tells the same story from a different angle. The top three programs by net benefit are Consultative Selling Sprint at $10,920, Excel Reporting Lab at $1,950, and Warehouse Safety Refresher at $1,265. Manager Fundamentals Cohort is not in that list because it loses money on the sample assumptions: $10,800 of adjusted benefit against $14,420 of actual cost. That does not automatically mean the training was a bad idea — manager training often has benefits that are hard to isolate — but it does mean I would not present that program as ROI-positive without better evidence.
Support Quality Coaching is the other row I would investigate. It is barely positive at $300 of net benefit, but the flag is Attendance Review, not ROI Review, because only 6 of 8 planned participants attended. Before judging the coaching itself, I would first ask why two people missed it and whether the outcome would look different after a make-up session.
Grab the training tracker template workbook if you want to change a cost line, flip an attendance row, or lower a confidence percentage and watch ROI Summary update.
How do I use this in Google Sheets?
Google Sheets works well for this employee training tracker google sheets use case because the workbook deliberately avoids Excel-only functions. Open Google Sheets, choose File > Import > Upload, select the downloaded .xlsx, and choose Insert new sheet(s). The formulas use only SUM, SUMIF, SUMIFS, IF, IFERROR, INDEX, MATCH, ABS, ROUND, LARGE, and arithmetic, all of which are supported natively in Google Sheets.
The Program ID, department, training type, status, and Yes/No dropdown validations also import with the workbook. After import, start in Training Plan, then replace the sample Costs, Attendance, and Outcomes rows the same way you would in Excel. There are no macros, no external workbook links, and no connected data sources to recreate.
If you’d rather skip the download-and-import step entirely, use this one-click copy link: make a copy of the Training Tracker Template in Google Sheets. Google will prompt you to save it to your own Drive, and from there it behaves identically to the Excel version — same sheets, same formulas, same ROI Summary roll-up.
If you only need a pure completion and overdue tracker, use my Excel training plan template instead. If your training problem is daily presence rather than learning outcomes, the attendance tracker template is the closer match.
Limitations to know before you rely on this
A few things are worth understanding before you use this workbook in a budget meeting:
- ROI is an estimate, not proof of causation. The workbook measures before/after movement and lets you assign a confidence percentage, but it cannot prove the training caused the entire change.
- One outcome metric per program keeps the model auditable. If a program has multiple benefits, either choose the clearest one or add extra outcome rows and extend the ROI Summary formulas carefully.
- Improvement Units use absolute movement.
ABS(Post Training Metric - Baseline Metric)works for both “higher is better” and “lower is better” examples, but you need to document the direction in Notes so nobody misreads the metric. - Review flags are simple sample rules. ROI Summary flags attendance below 80% as Attendance Review and negative ROI as ROI Review. Change those formulas if your organization uses different thresholds.
- The top-three ranking does not break ties. The
LARGEplusMATCHpattern returns the first matching program if two programs have the exact same net benefit. - No macros or external connections. Everything is native worksheet logic so the file stays portable between Excel and Google Sheets.
I would rather keep those limits visible than pretend a spreadsheet can solve attribution by itself. Used carefully, this workbook gives you a disciplined place to track training spend, participation, outcomes, and ROI without turning the process into a black box.
Download the training tracker template and replace the sample programs when you are ready.
