
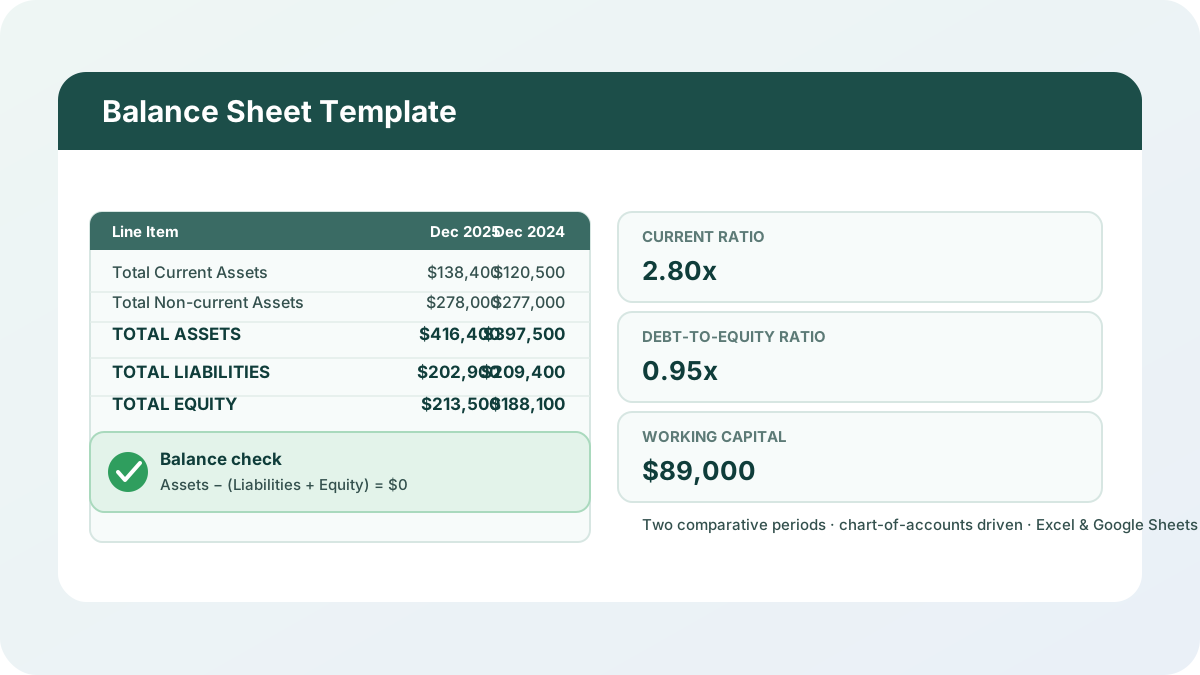
Every small business owner I’ve walked through a balance sheet template excel file has asked some version of the same question: “why doesn’t this balance?” It’s the single most common problem I see, and it’s almost never a formula bug — it’s a missing entry or a sign flipped the wrong way. This template exists to make that mistake visible immediately, with an explicit check cell that reads $0 the moment everything ties out.
Download the balance sheet template excel workbook — it’s a plain .xlsx, no macros, no external data connections, and no sign-up required.
Who is this template for?
I built this for a small business owner, bookkeeper, or finance generalist who needs a real balance sheet — not a simplified net-worth tracker — built around their own chart of accounts, with two periods side by side so you can see what moved. It’s also a solid teaching example if you want to see how a chart of accounts, a period-end balances sheet, and a formatted financial statement connect through plain SUM and lookup formulas, with nothing hidden behind a macro.
If you’re closer to the budgeting side of the business — building next year’s plan rather than closing last year’s books — my nonprofit budget template and construction budget template cover that ground for their respective use cases.
What’s in the workbook, sheet by sheet
The workbook ships with five sheets, in this exact order, because each one depends on the sheet before it:
- Instructions — a short setup guide plus a clean-room disclosure: every formula, layout, and sample figure in this workbook was authored from scratch for Excel.TV. No vendor template, workbook, or dataset was downloaded, inspected, or adapted to build it.
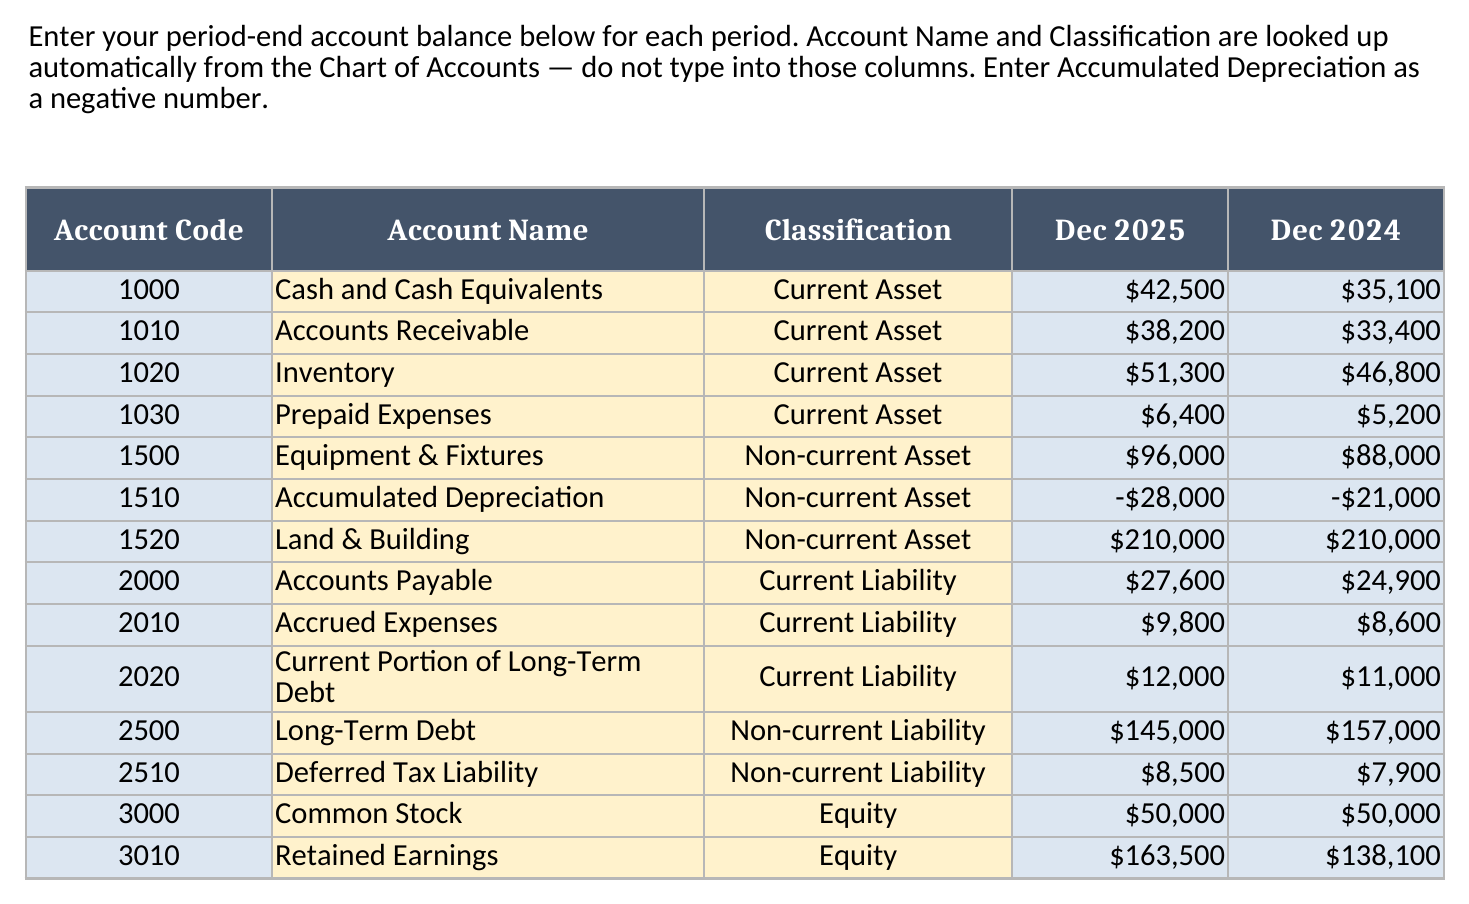
- Chart of Accounts — the master list of 14 sample accounts (code, name, classification, category, and notes). Classification — Current Asset, Non-current Asset, Current Liability, Non-current Liability, or Equity — is what tells the Balance Sheet which section an account belongs in.
- Account Balances Input — your period-end balance for every account, for the current period and the prior period. Account Name and Classification are looked up automatically.
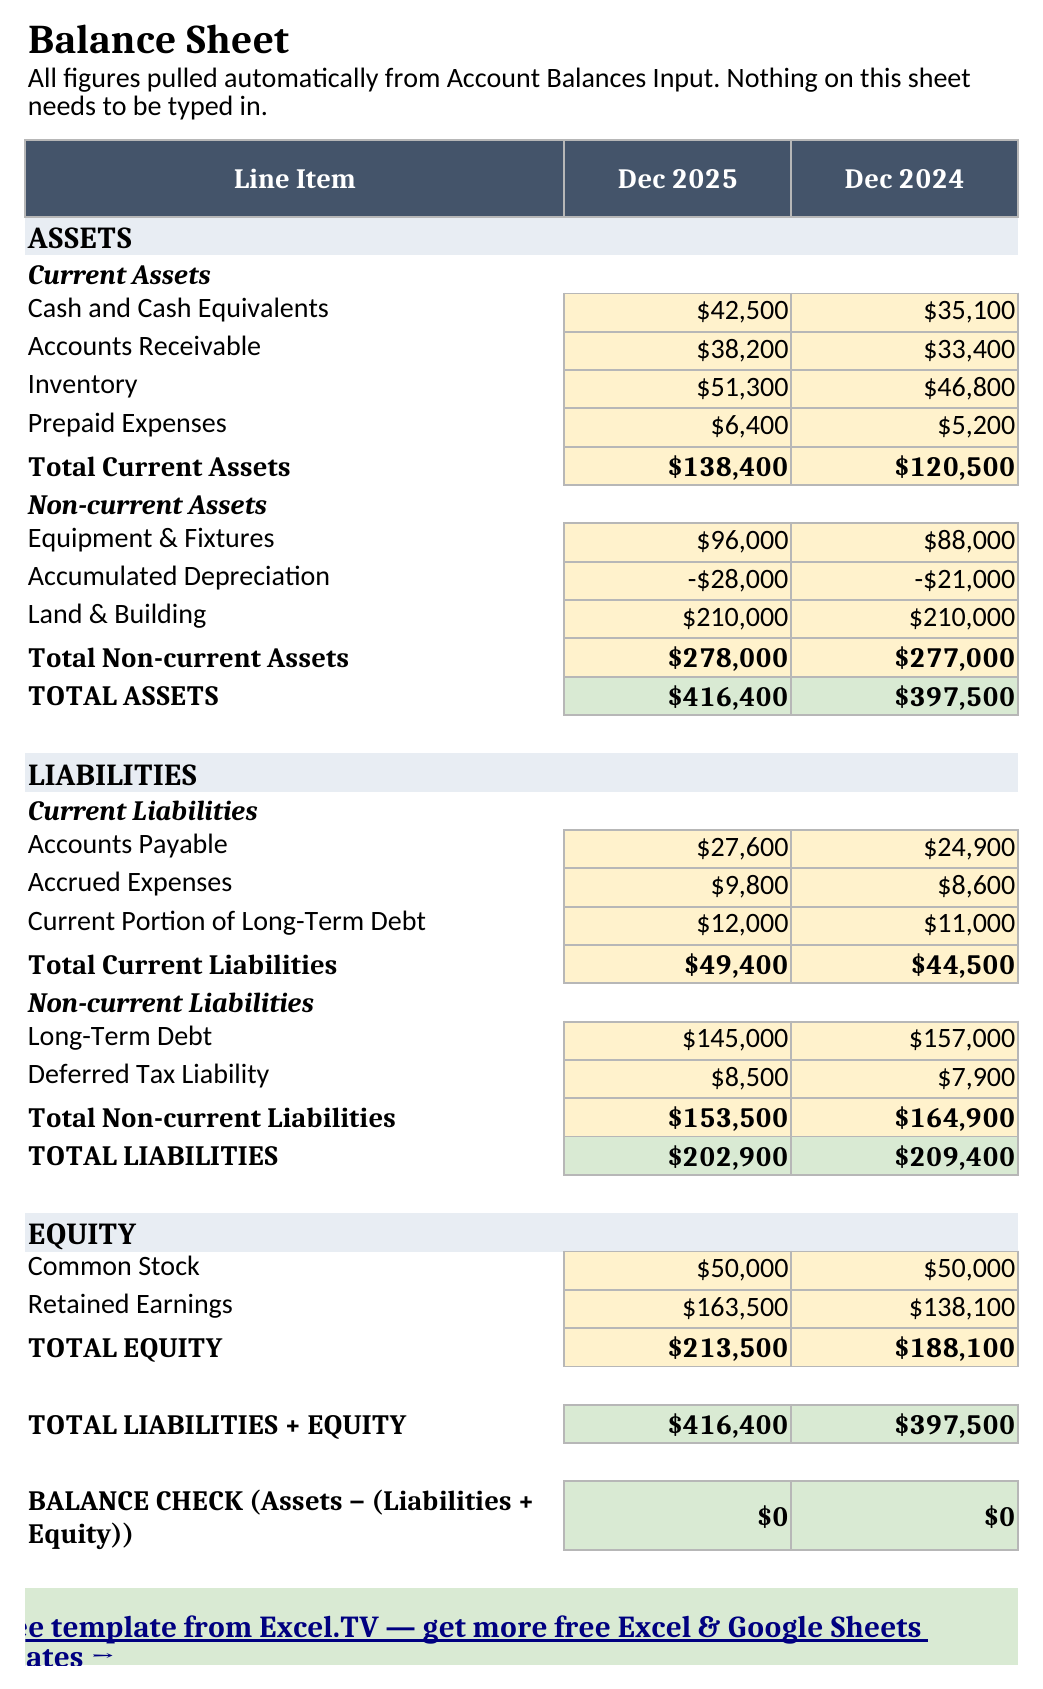
- Balance Sheet — the formatted statement: Assets, Liabilities, and Equity for both periods, ending in a balance check row.
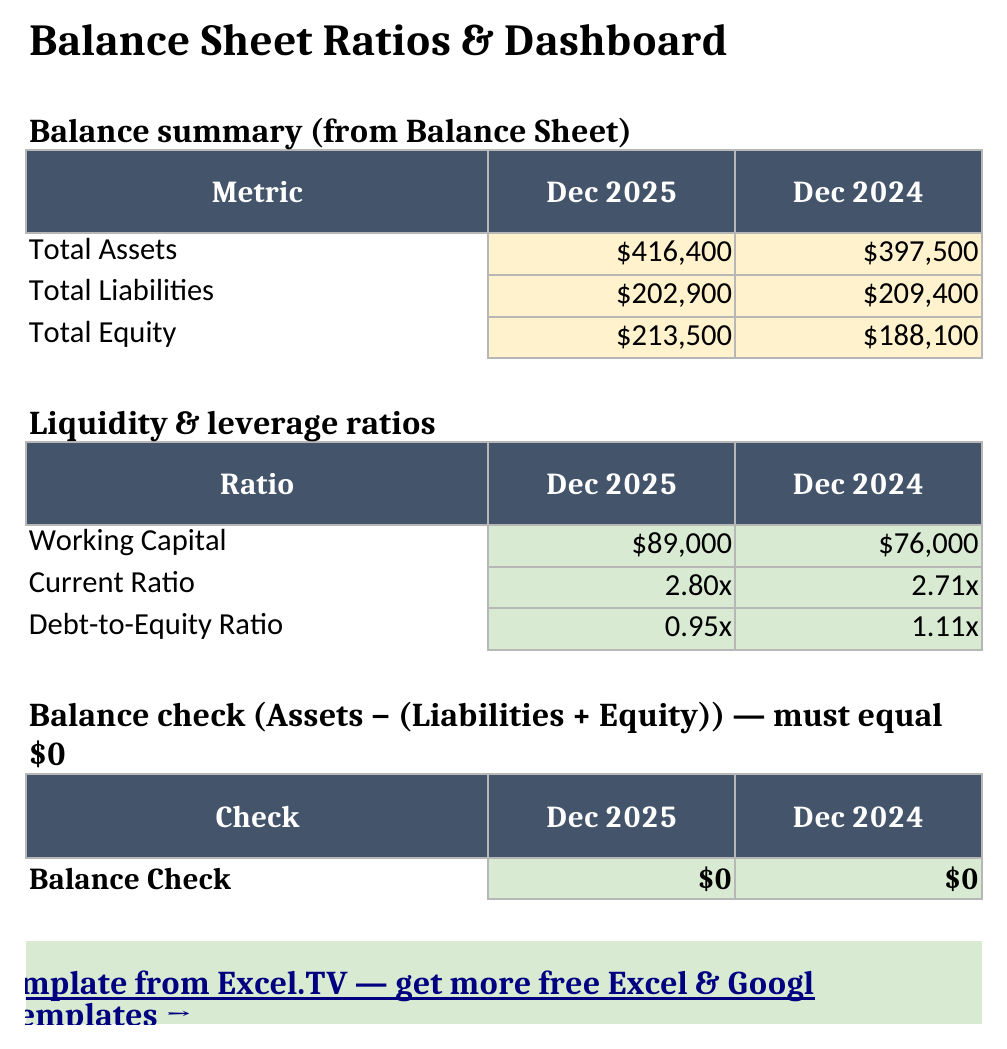
- Ratios & Dashboard — a one-page summary of total assets, liabilities, and equity, plus working capital, current ratio, and debt-to-equity ratio for both periods.
The required input is just one number per account per period: the period-end balance on Account Balances Input. The main outputs are the Balance Sheet statement, its balance check, and the ratio panel on Ratios & Dashboard — all of which recalculate the instant you edit an input cell.
How do I set up the balance sheet template?
- Open Chart of Accounts and adjust the sample account list to match your own books — keep each account’s Classification accurate, and keep the account order the same across sheets, since the Balance Sheet’s line items depend on it.
- Open Account Balances Input and enter your account balance for each period. Enter Accumulated Depreciation as a negative number — it’s a contra-asset account, and entering it positive is the single most common way this template stops balancing.
- Open Balance Sheet to see the formatted statement recalculate automatically, ending in the balance check row.
- Open Ratios & Dashboard for the one-page summary of current ratio, debt-to-equity ratio, and working capital.
Because Account Name and Classification on Account Balances Input are INDEX/MATCH formulas rather than typed text, a typo in an account code shows up immediately as “(unknown account)” instead of silently breaking a lookup three sheets later.
The chart-of-accounts structure, and why it matters for a companion P&L
The Chart of Accounts sheet isn’t just a list — it’s the same code/name/category/notes shape I use across chart-of-accounts-driven templates in this library, so the account list you build here is largely reusable if you ever add a companion profit and loss statement on the same chart of accounts. The only balance-sheet-specific addition is the Classification column (Current Asset, Non-current Asset, Current Liability, Non-current Liability, Equity), which routes each account to the right section and subtotal on the Balance Sheet.
That reuse only works, though, if the account order stays identical across Chart of Accounts, Account Balances Input, and Balance Sheet. Insert a new account in the middle of one sheet without inserting it in the same spot on the others, and the Balance Sheet’s line-item references — which pull directly from Account Balances Input by row — will point at the wrong account. It’s a deliberate tradeoff: direct row references are simpler to audit than a lookup on every line, but the three sheets move together, not independently.
Worked example: two year-end balance sheets, and why they balance
Here’s what the workbook produces for the sample chart of accounts, pulled straight from the Balance Sheet and Ratios & Dashboard sheets after a full recalculation — not rounded, not estimated:
| Line | Dec 2025 | Dec 2024 |
|---|---|---|
| Total Current Assets | $138,400 | $120,500 |
| Total Non-current Assets | $278,000 | $277,000 |
| TOTAL ASSETS | $416,400 | $397,500 |
| Total Current Liabilities | $49,400 | $44,500 |
| Total Non-current Liabilities | $153,500 | $164,900 |
| TOTAL LIABILITIES | $202,900 | $209,400 |
| TOTAL EQUITY | $213,500 | $188,100 |
| Total Liabilities + Equity | $416,400 | $397,500 |
| Balance check (Assets − (Liabilities + Equity)) | $0 | $0 |
Both columns balance to the dollar, because Total Assets ($416,400 and $397,500) exactly equals Total Liabilities plus Total Equity in both periods. That’s not a coincidence built into the demo data to look tidy — it’s what a correct balance sheet is supposed to do every single time, for every period, and the check row exists so you can confirm it rather than assume it.
Looking at what moved: cash grew from $35,100 to $42,500 and inventory grew from $46,800 to $51,300, pushing current assets up by $17,900 year over year. On the other side, long-term debt was paid down from $157,000 to $145,000, and equity grew by $25,400 — almost entirely from the $25,400 increase in Retained Earnings ($138,100 to $163,500), which is exactly what you’d expect from a profitable year that didn’t take on new debt.
Why doesn’t my balance sheet balance? (the most common real problem)
This is the question I get asked more than any other, so it’s worth its own section instead of a single FAQ line. When the balance check row doesn’t read $0, work through these in order — in my experience this covers nearly every case:
- A row is missing a balance. Scroll down Account Balances Input and confirm every account in both period columns has a number in it. A blank cell reads as zero, which quietly understates whichever side of the equation that account sits on.
- A contra-asset account has the wrong sign. Accumulated Depreciation reduces total assets, so it has to be entered as a negative number. Enter it as positive by mistake and Total Assets comes in too high by exactly double the depreciation balance — a telltale sign if your balance check is off by a suspiciously round, doubled-looking number.
- Retained Earnings wasn’t updated for the period. Unlike a fully automated close, this template’s Retained Earnings is a direct input, not a formula pulling from a linked profit and loss statement. If you’re closing a new period and forget to roll the prior period’s net income into Retained Earnings, the balance sheet won’t balance — because your other accounts moved but equity didn’t catch up.
- An account was entered under the wrong classification. If an account is marked “Current Liability” but behaves like equity in your books (or vice versa), the section subtotals will still add up to the same Total Assets and Total Liabilities + Equity — so this one won’t break the balance check, but it will make the Current Ratio and Working Capital numbers on Ratios & Dashboard wrong. Worth checking even when the balance check reads $0.
Once you’ve ruled out those four, the balance check will read $0, and it’ll stay that way as long as every future entry follows the same discipline.
The ratios, and what they’re telling you here
Ratios & Dashboard pulls three numbers straight from the Balance Sheet for both periods:
- Working Capital (Current Assets − Current Liabilities): $89,000 in Dec 2025, up from $76,000 in Dec 2024 — more of a cushion to cover near-term obligations.
- Current Ratio (Current Assets ÷ Current Liabilities): 2.80x in Dec 2025, up slightly from 2.71x — comfortably above the 1.0x line where current liabilities would outrun current assets.
- Debt-to-Equity Ratio (Total Liabilities ÷ Total Equity): 0.95x in Dec 2025, down from 1.11x — leverage easing as debt gets paid down and retained earnings build up.
None of these three numbers require anything beyond the Balance Sheet’s own subtotal rows, which is deliberate — a ratio panel that depends on inputs you haven’t already entered for the statement itself is one more place for the two to drift out of sync.
How do I use this in Google Sheets?
Google Sheets is a first-class destination for this excel balance sheet template, not an afterthought. Open Google Sheets, choose File > Import > Upload, select the downloaded .xlsx, and pick “Insert new sheet(s).” Every formula in this workbook — SUM, IF, and IFERROR — is natively supported in Google Sheets, so nothing needs to be rewritten and the dropdown data validation on Classification carries over with it.
If you’d rather skip the download-and-import step entirely, use this one-click copy link: make a copy of the Balance Sheet Template in Google Sheets. Google will prompt you to save it to your own Drive, and from there it behaves identically to the Excel version — same sheets, same formulas, same balance check.
If you’re assembling a fuller monthly reporting package once your balance sheet is under control, my finance dashboard template covers the budget-vs-actual and variance side of monthly close reporting; and if inventory valuation feeds into your balance sheet from an operations side, my restaurant inventory & P&L template shows one way to connect inventory counts through to a P&L.
Limitations to know before you rely on this
A few things are worth knowing before you put real numbers in:
- Every sheet needs the same account order. The workbook assumes 14 fixed accounts in the same order across Chart of Accounts, Account Balances Input, and Balance Sheet. Insert or remove a row on one sheet without the others and the Balance Sheet’s line items will point at the wrong account.
- Retained Earnings is a direct input, not an automatic roll-forward. This template doesn’t include a linked profit and loss statement, so Retained Earnings has to be updated by hand each period to include the prior period’s net income. A companion Profit & Loss template, when it ships, is designed to feed this number automatically.
- Accumulated Depreciation must be entered as a negative number. It’s a contra-asset account netting against Equipment & Fixtures and Land & Building — enter it positive and Total Assets will be overstated.
- No macros, no external connections. Everything here is a native formula. That’s deliberate — it’s what keeps the workbook portable between Excel and Google Sheets with zero substitutions.
I’d rather flag these limitations up front than have you discover them while you’re trying to figure out why a number won’t tie out. Once you know the account-order rule and the Retained Earnings rule, the balance check does the rest of the work for you.
Grab the balance sheet template excel workbook and swap in your own chart of accounts — the balance check will tell you immediately if something doesn’t add up.
