
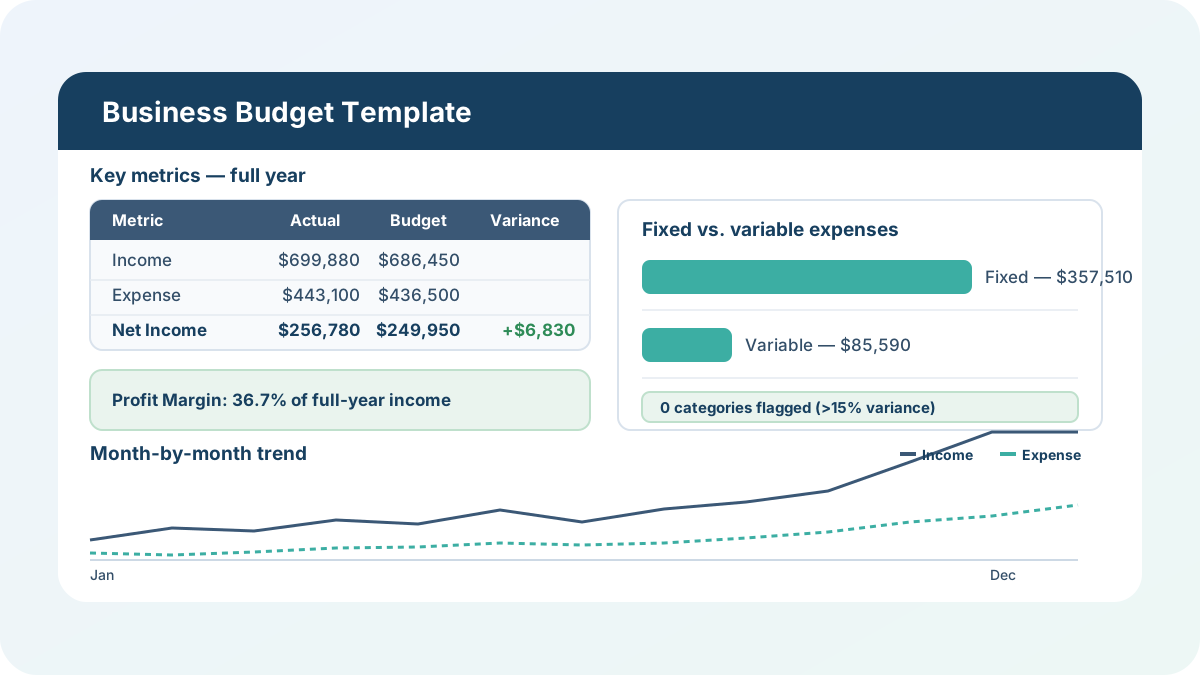
I’ve rebuilt this Excel budget template from the ground up around the question every small business owner actually asks at year-end: not “what did we spend on rent,” but “where did we miss budget, and by how much.” This workbook tracks income and expense categories by month across a full calendar year, compares actual results to your budget for every category, and rolls all of it into a year-end summary with a fixed vs. variable expense split and a month-by-month trend.
Download the business budget template — it’s a plain .xlsx, no macros, no external data connections, and no sign-up. Open it in Excel or Google Sheets and start replacing the sample numbers with your own.
If you’d rather understand every formula and layout decision before you use a finished file, I walk through how to build your own budget spreadsheet in Excel step by step. Use that guide when you want the blank-workbook build; stay here when you want the ready-made workbook and the budget-vs-actual checks already wired up.
Who is this template for?
I built this for a small business owner, bookkeeper, or solo operator who wants a monthly budget-vs-actual habit without building the tracking sheet from scratch every January. It works just as well as a personal or household budget: the mechanics — monthly income and expense entry, a fixed/variable split, and a year-end variance rollup — don’t care whether the categories are “Payroll & Benefits” or “Groceries.” If you can list your income sources and expense categories and put a monthly number against each one, this template will do the comparison work for you.
What’s in the workbook, sheet by sheet
The workbook ships with six sheets, in this exact order, because each one depends on the sheet before it:
- Instructions — a short setup guide plus a clean-room disclosure: every formula, layout, and sample figure in this workbook was authored from scratch for Excel.TV. No vendor template, workbook, or dataset was downloaded, inspected, or adapted to build it.
- Categories — the master list of 13 sample income and expense categories (code, name, type, group, and notes). Group marks each Expense category Fixed or Variable; it’s N/A for Income categories.
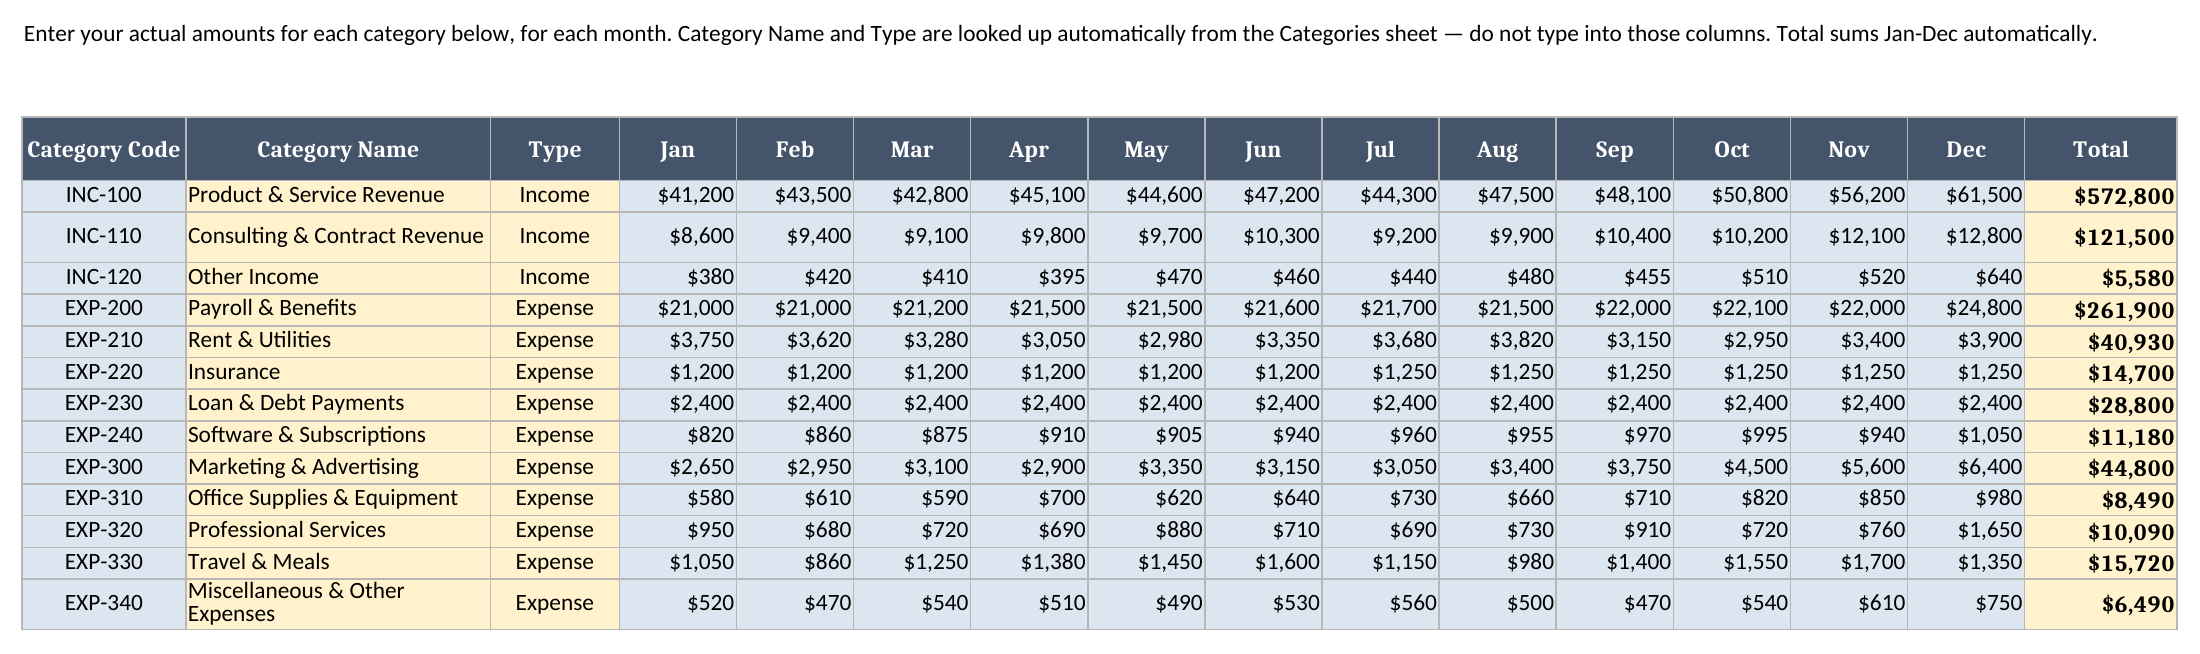
- Monthly Actuals Input — your actual amounts, one row per category, one column per month, Jan through Dec, with a Total column that sums the year automatically.
- Monthly Budget Input — your budgeted amounts, laid out exactly the same way as Monthly Actuals Input.
- Budget vs Actual — a fully calculated sheet that pulls the full-year total for every category from both input sheets and flags any category more than 15% off budget for the year.
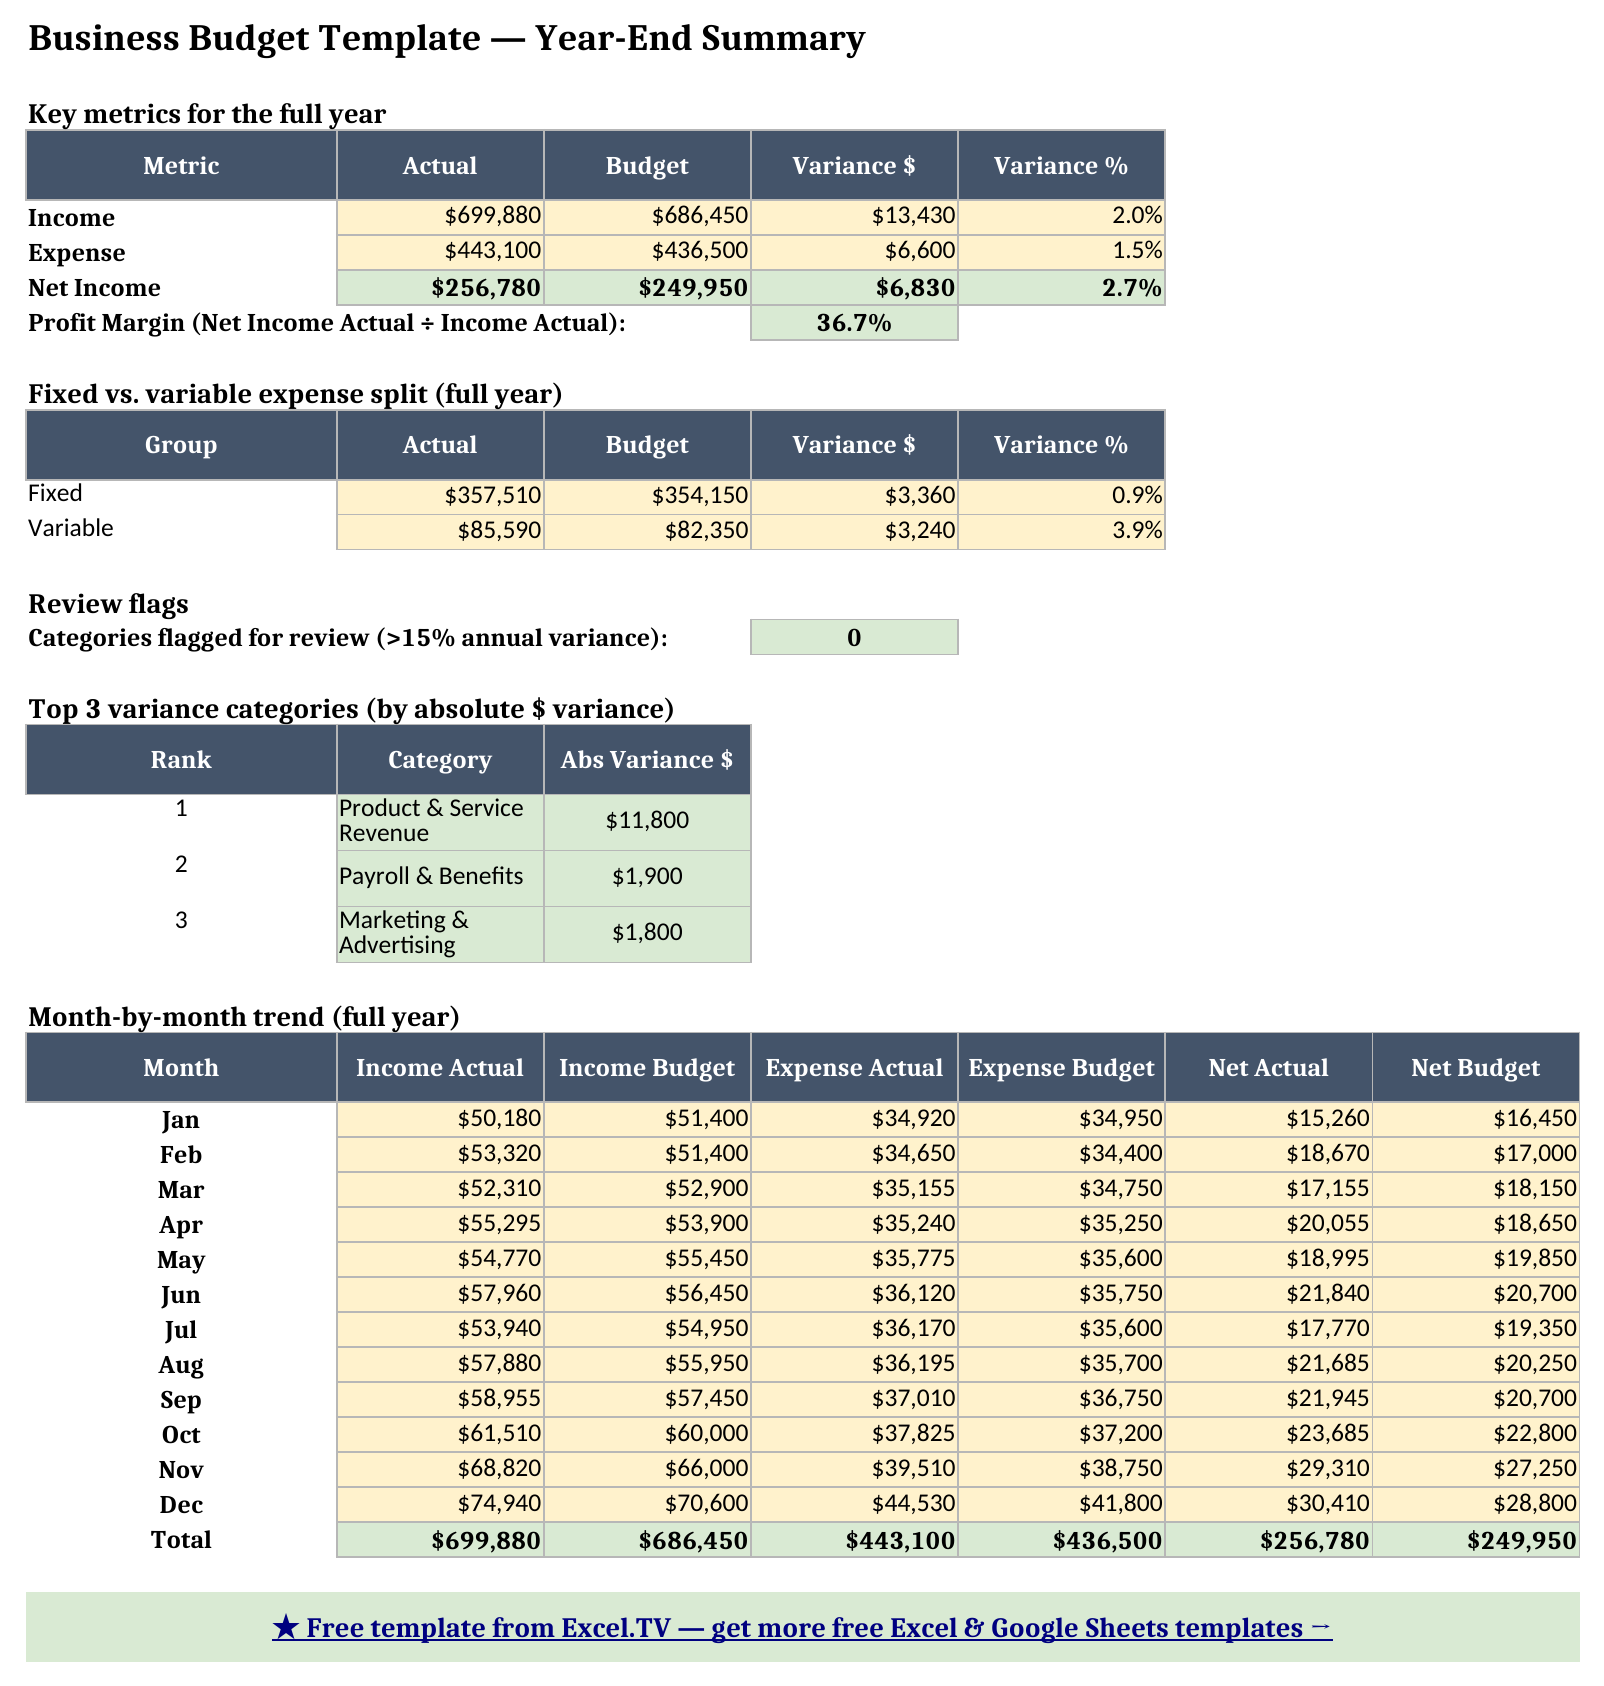
- Summary — the year-end dashboard: income/expense/net income vs. budget, a fixed vs. variable expense split, a count of categories flagged for review, the three largest dollar variances, and a month-by-month trend table for the full year.
The required inputs are just two things per category per month: an actual amount on Monthly Actuals Input and a budgeted amount on Monthly Budget Input. The main outputs are the Summary sheet’s key metrics, the fixed/variable split, the flagged-category count, the top-3 variance ranking, and the month-by-month trend — all of which recalculate the instant you edit an input cell.
How do I set up the business budget dashboard?
- Open Categories and replace the sample category list with your own — keep each Category Code unique, since every lookup in the workbook keys off it. Set Type to Income or Expense, and set Group to Fixed or Variable on every Expense row.
- Open Monthly Actuals Input and enter your actual amounts for each category, for each of the 12 months. Don’t type into the Category Name or Type columns — they’re formulas that look up from Categories automatically.
- Open Monthly Budget Input and enter your budgeted amounts in the same category order.
- Check Budget vs Actual for the category-level annual variance behind the Summary sheet’s totals.
- Open Summary for the year-end numbers — the fixed vs. variable split and the month-by-month trend are usually the first things a co-owner, lender, or accountant asks to see.
Because Category Name and Type on both input sheets are INDEX/MATCH formulas rather than typed text, a typo in a category code shows up immediately as “(unknown category)” instead of silently mismatching later — a real time-saver when you’re re-entering a year’s worth of monthly figures.
How the Budget vs Actual variance works
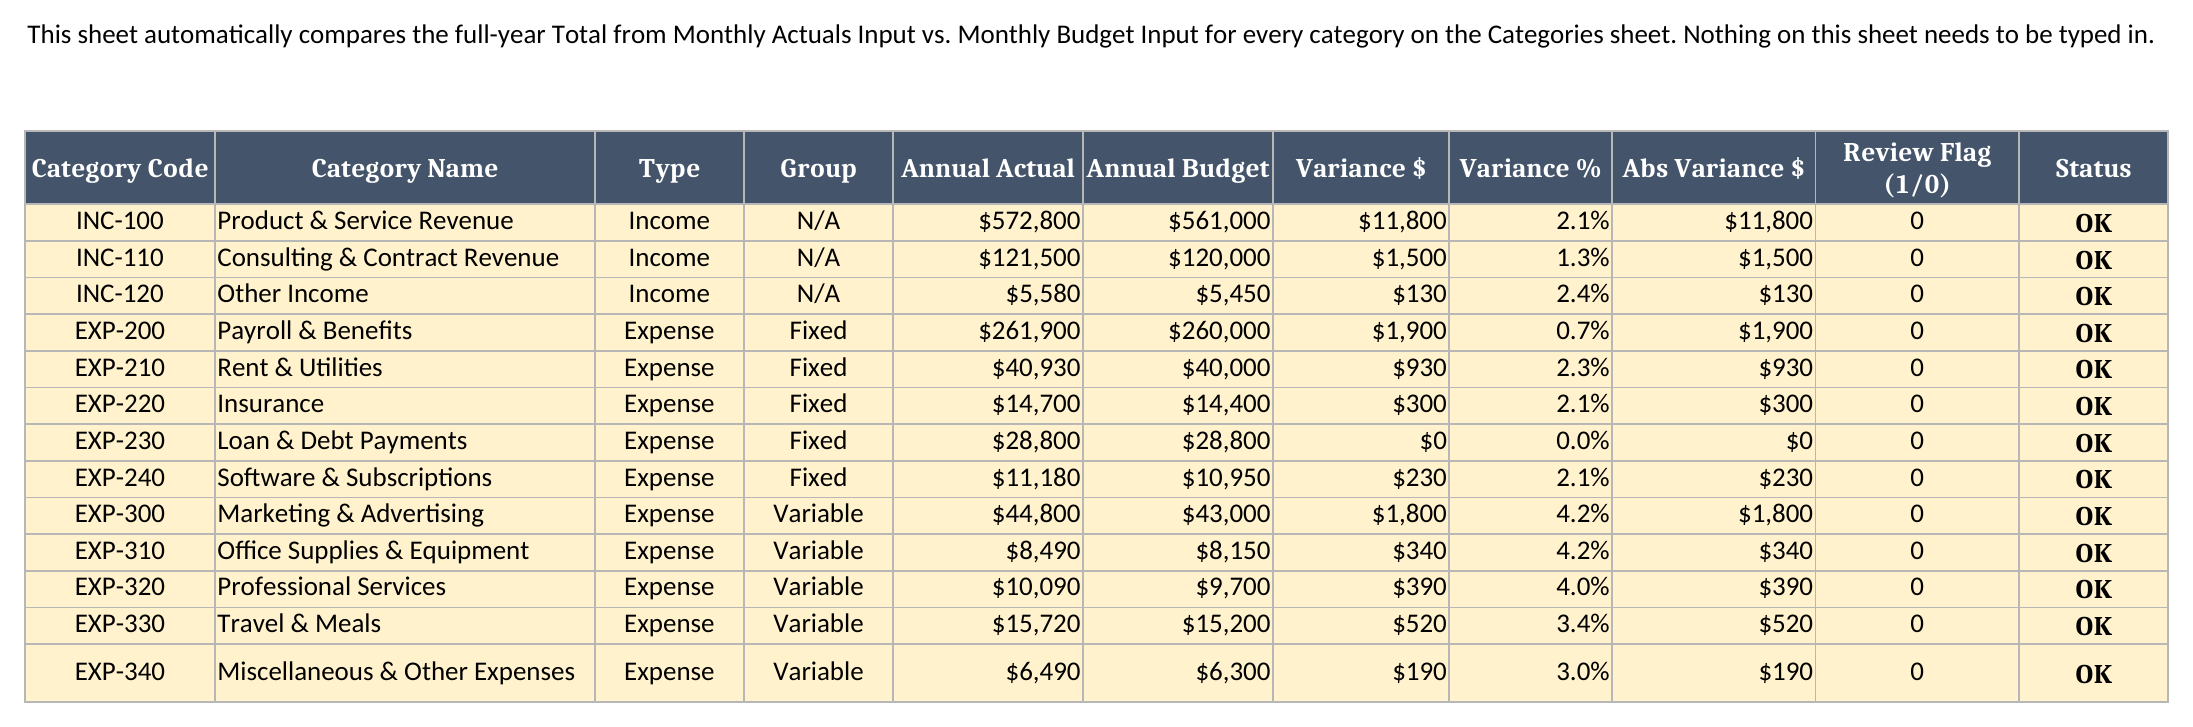
Budget vs Actual is where the comparison happens, and you never type into it. For every category, it pulls the full-year Total from Monthly Actuals Input and Monthly Budget Input with an INDEX/MATCH keyed on Category Code, then calculates a dollar variance, a percent variance, and an absolute-value variance. A Review Flag column marks any category more than 15% off budget for the year, and a Status column turns that flag into a plain “Review” or “OK.”
In the sample data, every one of the 13 categories lands inside that 15% band for the year — the biggest single miss is Marketing & Advertising at 4.2% over budget — so the Status column reads “OK” straight down. That’s a realistic result for a business tracking close to plan; if you enter your own numbers and a category comes in further off than that, the Status column is what flags it for you.
Fixed vs. variable expenses — and why the split matters
Every Expense category on the Categories sheet gets a Group of Fixed or Variable. Fixed covers the costs that show up close to the same amount every month regardless of how business is going — Payroll & Benefits, Rent & Utilities, Insurance, Loan & Debt Payments, and Software & Subscriptions in the sample data. Variable covers costs that move with activity and the calendar — Marketing & Advertising, Office Supplies & Equipment, Professional Services, Travel & Meals, and Miscellaneous & Other Expenses.
That split matters because it changes what a variance means. A 4% overspend on a Fixed category like Rent & Utilities usually means a rate change or a seasonal utility spike — not much a monthly decision can do about it. The same 4% overspend on a Variable category like Marketing & Advertising is a spending decision you made that month, and it’s the lever you can pull next month to bring costs back in line. In the sample year, Fixed expenses came in at $357,510 against a $354,150 budget (0.9% over) while Variable expenses came in at $85,590 against $82,350 (3.9% over) — the levers you can actually control tend to drift further from budget than the ones you can’t.
Worked example: the full year, pulled from the workbook
I built a full year of synthetic sample data into the template so you can see the year-end numbers react to a real seasonal pattern instead of a flat average — revenue and marketing spend both ramp up heading into Q4. Here’s what the workbook shows by quarter, pulled straight from the Summary sheet’s month-by-month trend after a full recalculation:
| Quarter | Income Actual | Income Budget | Expense Actual | Expense Budget | Net Income Actual | Net Income Budget |
|---|---|---|---|---|---|---|
| Q1 (Jan–Mar) | $155,810 | $155,700 | $104,725 | $104,100 | $51,085 | $51,600 |
| Q2 (Apr–Jun) | $168,025 | $165,800 | $107,135 | $106,600 | $60,890 | $59,200 |
| Q3 (Jul–Sep) | $170,775 | $168,350 | $109,375 | $108,050 | $61,400 | $60,300 |
| Q4 (Oct–Dec) | $205,270 | $196,600 | $121,865 | $117,750 | $83,405 | $78,850 |
| Full year | $699,880 | $686,450 | $443,100 | $436,500 | $256,780 | $249,950 |
Q1 comes in almost exactly on plan for Net Income — $51,085 actual against a $51,600 budget, a $515 miss barely worth a second look. Q2 and Q3 both run ahead of budget by roughly $1,100–$1,700, driven by income coming in a little hotter than planned. Q4 is where it gets interesting: income beats budget by $8,670 (4.4%) as the holiday season kicks in, but expenses also run $4,115 over budget — largely Marketing & Advertising ramping up to chase that revenue. Net Income still finishes Q4 $4,555 ahead of budget, a good reminder to check which Categories are driving both sides of a quarter rather than just the bottom line.
For the full year, Net Income lands at $256,780 against a $249,950 budget — a $6,830 (2.7%) favorable variance — for a 36.7% profit margin. The top three variance categories by absolute dollar amount are Product & Service Revenue ($11,800 over budget), Payroll & Benefits ($1,900 over budget), and Marketing & Advertising ($1,800 over budget), all visible on the Summary sheet without opening Budget vs Actual.
Grab the business budget template if you want to change a monthly input and watch the quarter, the fixed/variable split, and the top-3 ranking all update live.
How do I use this in Google Sheets?
Google Sheets is a first-class destination for this business budget template, not an afterthought. Open Google Sheets, choose File > Import > Upload, select the downloaded .xlsx, and pick “Insert new sheet(s).” Every formula in this workbook — SUM, SUMIF, SUMIFS, IF, IFERROR, INDEX, MATCH, ABS, ROUND, and LARGE — is natively supported in Google Sheets, so nothing needs to be rewritten.
If you’d rather skip the download-and-import step entirely, use this one-click copy link: make a copy of the Business Budget Template in Google Sheets. Google will prompt you to save it to your own Drive, and from there it behaves identically to the Excel version — same sheets, same formulas, same fixed/variable split.
If you’re building out a fuller reporting package and want the same variance mechanics with a chart-of-accounts layer, my finance dashboard template covers a month-selector-driven variance dashboard; if you need a full general ledger underneath the budget numbers, my small business accounting template covers double-entry bookkeeping with a trial balance check; and if you’re tracking reimbursable spending separately from your budget categories, my expense report template handles mileage and per-employee expense claims.
Limitations to know before you rely on this
A few things are worth knowing before you put real numbers in:
- Every sheet needs the same category order. The workbook assumes each Category Code is unique and appears exactly once, in the same set of rows, on Categories, Monthly Actuals Input, and Monthly Budget Input. Insert a row in one sheet without inserting it in the others and the lookups will mismatch.
- The Fixed/Variable split is a manual designation, not derived automatically. The Group value you set on each Expense category on the Categories sheet drives the split directly — it isn’t calculated from spending patterns, so it’s only as accurate as the categories you assign.
- Ties in the top-3 ranking aren’t broken. The
LARGE+MATCHpattern that ranks the three biggest variances returns the first matching category if two categories tie exactly on absolute dollar variance — an inherent limitation of this lookup pattern without an added tie-breaker column. - The 15% review threshold is a fixed sample value. Change the flag formula on Budget vs Actual directly if you want a tighter or looser bar — a monthly budget review often wants a tighter threshold than an annual one.
- This template compares full-year totals, not month-by-month variance per category. The Summary sheet’s month-by-month trend shows Income, Expense, and Net Income by month, but Budget vs Actual’s variance flag is calculated on the annual total per category — a category that’s over budget in Q4 and under budget earlier in the year could still show “OK” on an annual view.
- No macros, no external connections. Everything here is a native formula. That’s deliberate — it’s what keeps the workbook portable between Excel and Google Sheets with zero substitutions.
I’d rather flag these limitations up front than have you discover them mid-review. Once you know the category-order rule and the Fixed/Variable rule, the rest of the workbook takes care of itself.
